|
|
|

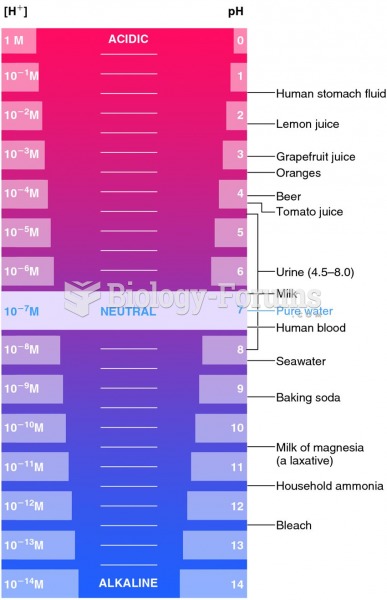 The pH scale and the relative acidities of common substances
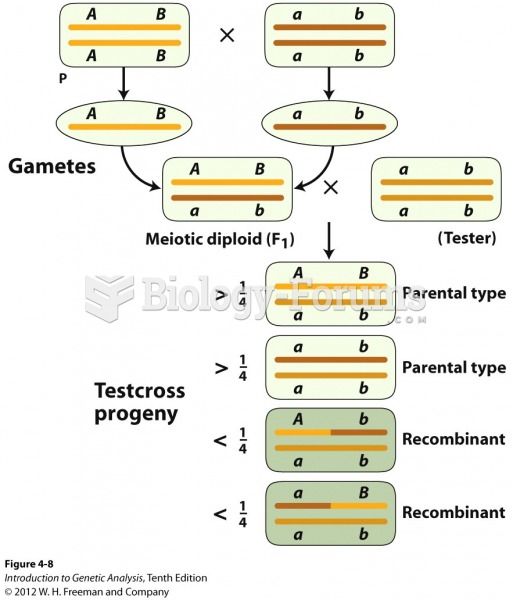 For linked genes, recombinant frequencies are less than 50 percent
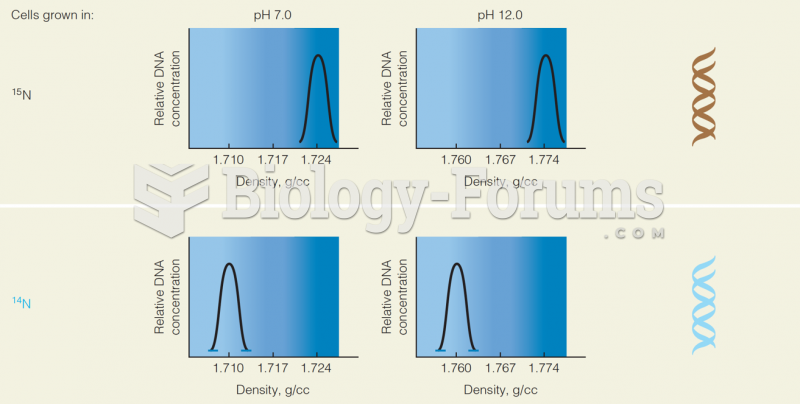 Cell Grown in 15N and 14 N: Graph of Relative DNA Concentration Vs. the Density
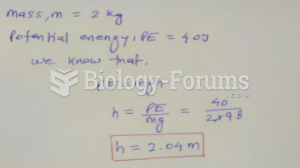 A 2-kg box of taffy candy has 40 J of potential energy relative to the ground. Its height above ...
 The effect of selection on allele frequency
 Relative lifetime risk of schizophrenia