This topic contains a solution. Click here to go to the answer
|
|
|

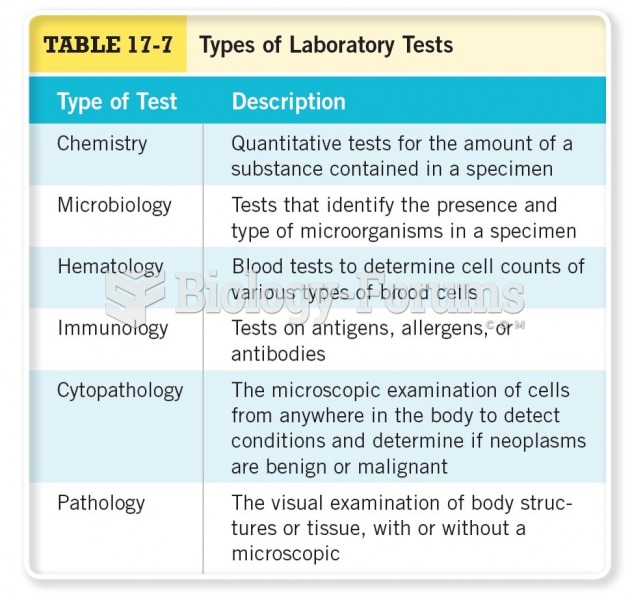 Types of Laboratory Tests
 Cloud Types: Vertical Development
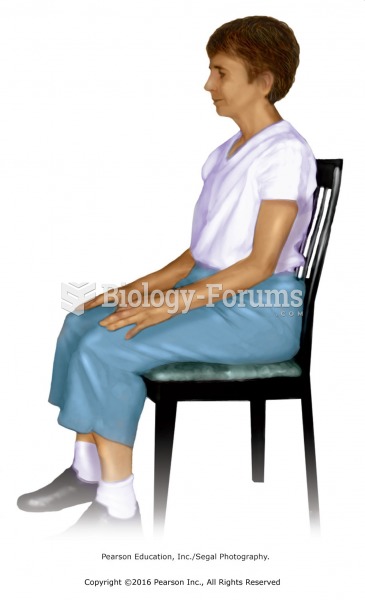 A good posture for practicing meditation is seated in a chair with the back upright and in ...
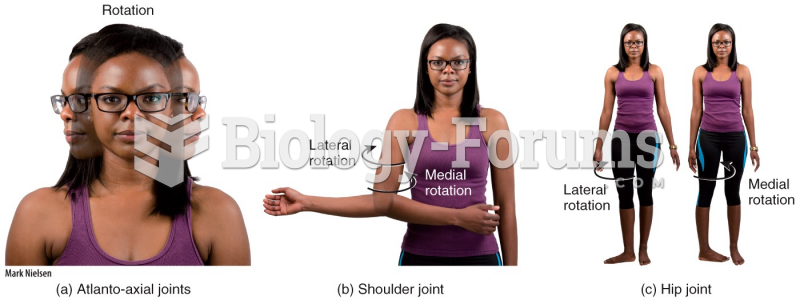 Types of Movement at Synovial Joints
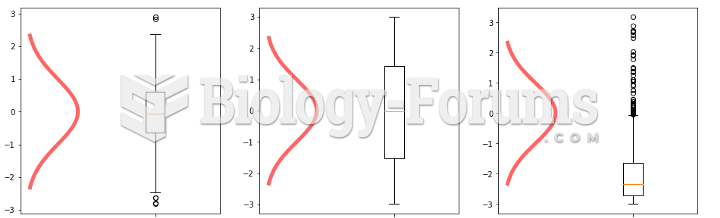 Histograms - Analysis and Data
 Chi-Square Analysis of Mendel’s Trihybrid-Cross Data