This topic contains a solution. Click here to go to the answer
|
|
|

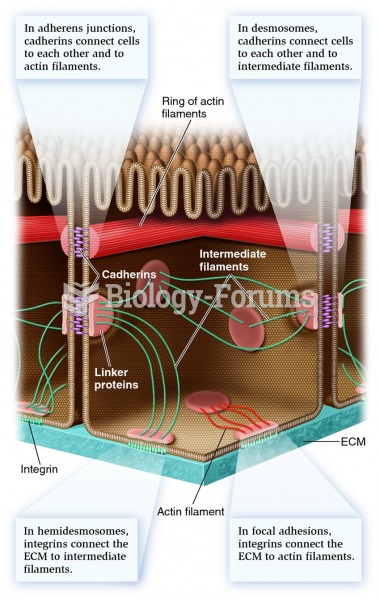 Types of anchoring junctions
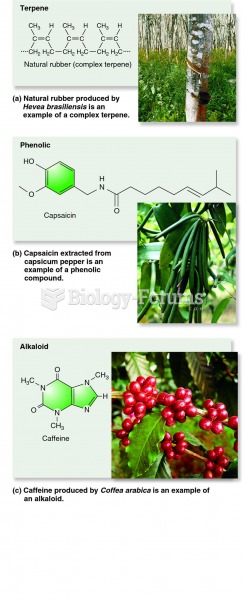 Major types of plant secondary metabolites
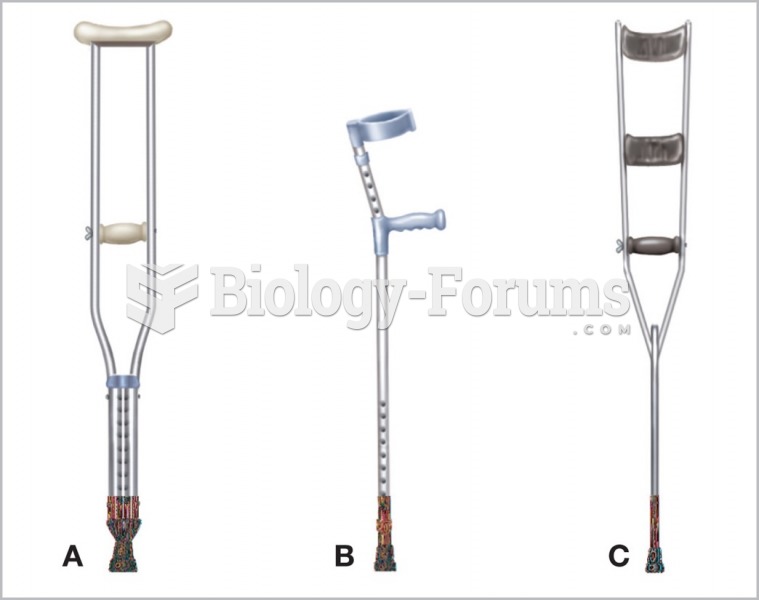 Three types of crutches: (A) axillary crutch; (B) Lofstrand or forearm crutch; (C) Canadian or elbow ...
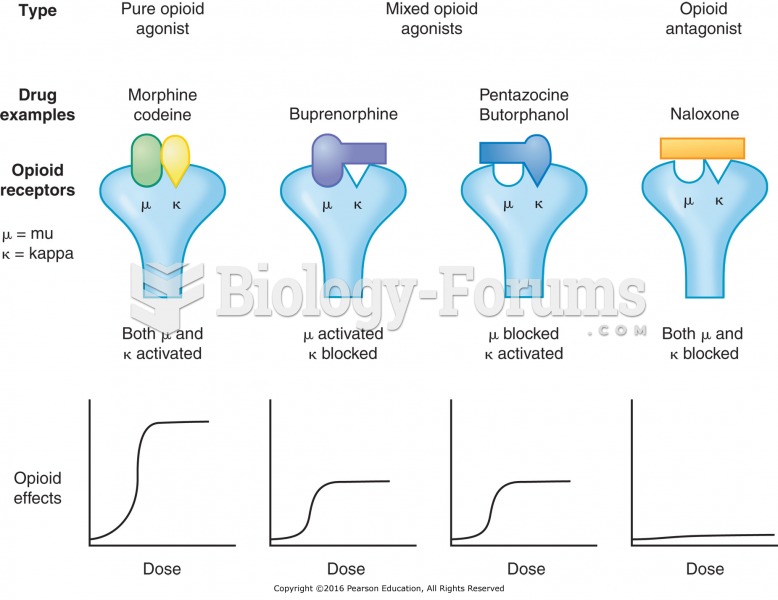 Types of opioid receptors.
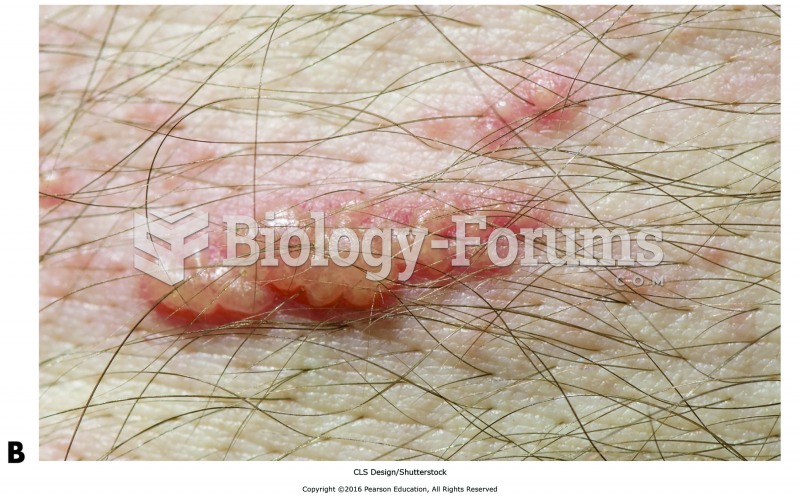 Various types of integumentary conditions.(B) Herpes simplex.
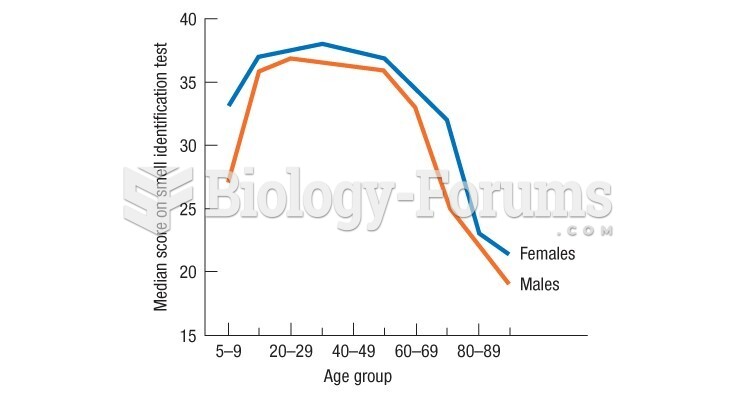 Doty's data show a very rapid drop in late adulthood in the ability to identify smells