This topic contains a solution. Click here to go to the answer
|
|
|

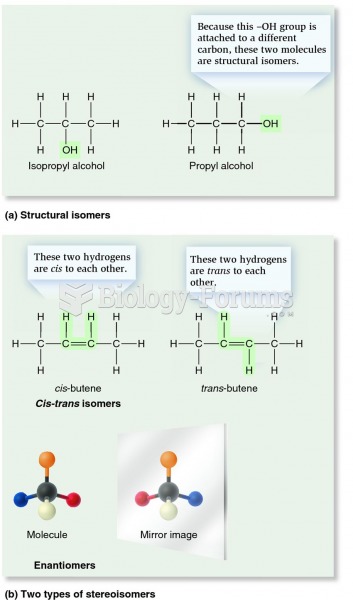 Types of isomers
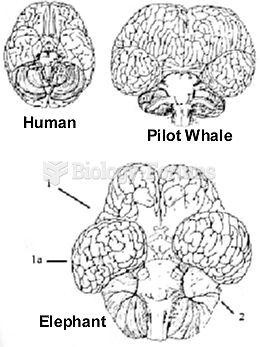 Human, pilot whale and elephant brains up to scale. (1)-cerebrum (1a)-temporal lobe and (2)-cerebell
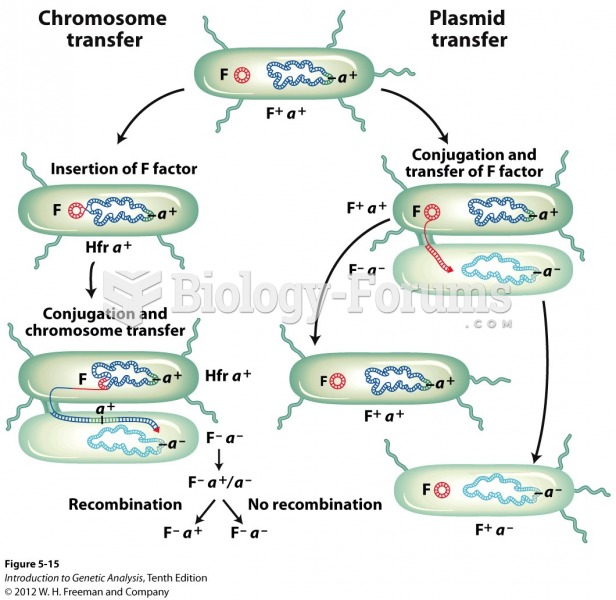 Two types of DNA transfer can take place during conjugation
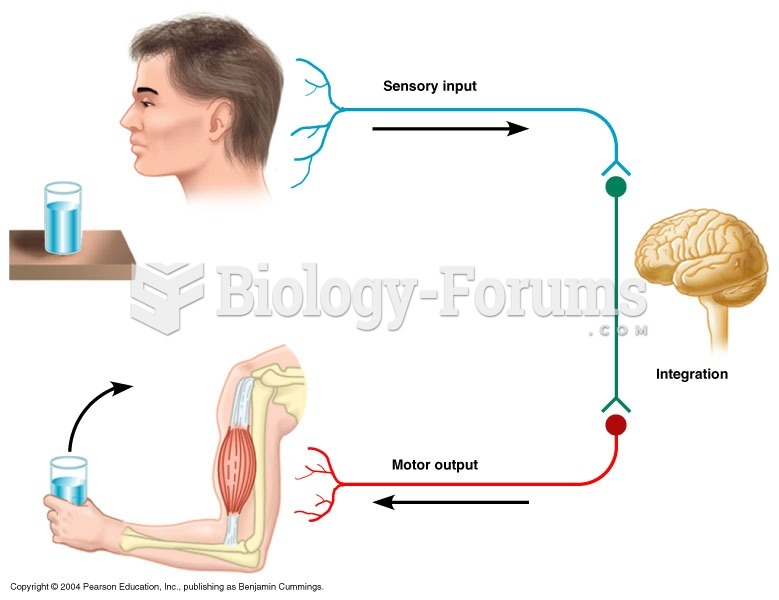 Types of Neurons
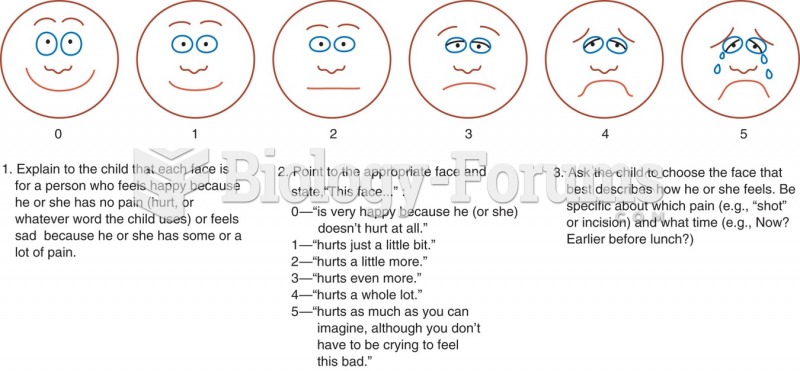 The Wong/Baker FACES rating scale.
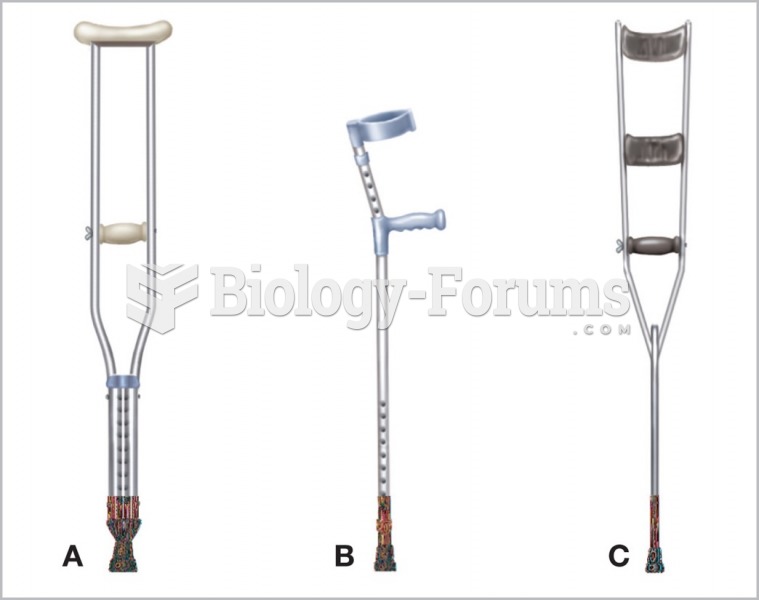 Three types of crutches: (A) axillary crutch; (B) Lofstrand or forearm crutch; (C) Canadian or elbow ...