This topic contains a solution. Click here to go to the answer
|
|
|

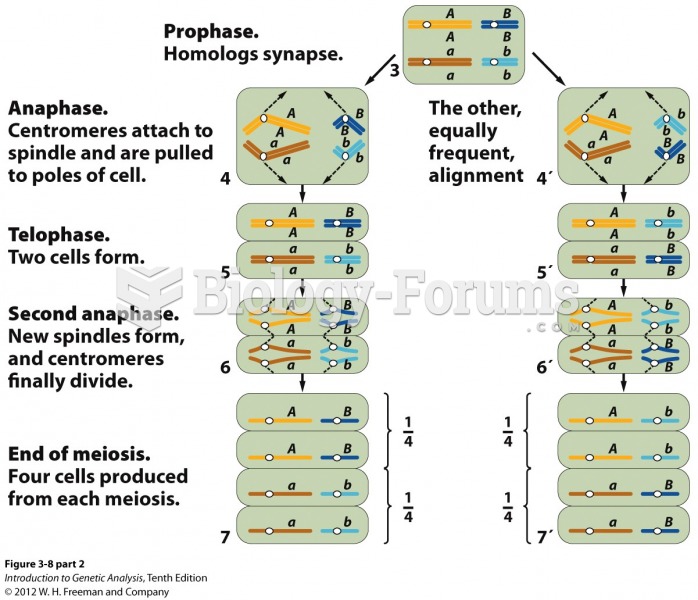 Independent assortment of chromosomes at meiosis explains Mendel’s ratio
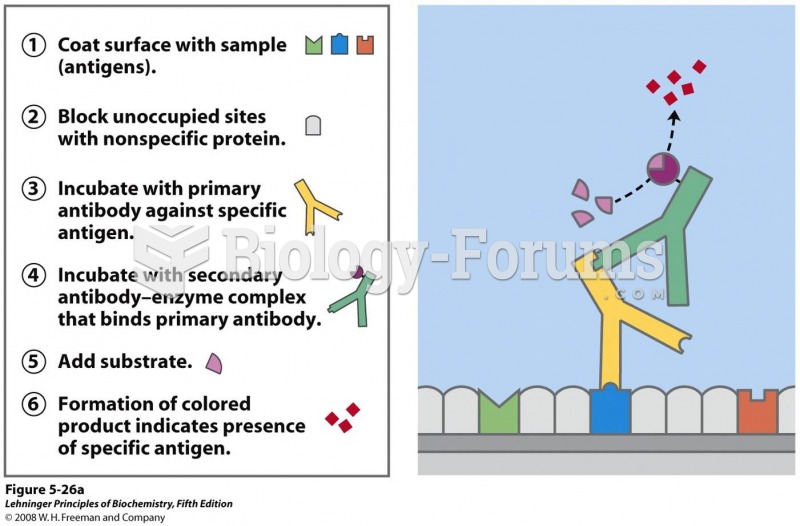 Antibody techniques. The specific reaction of an antibody with its antigen
 Performing Transmission-Based Precaution: Isolation Techniques
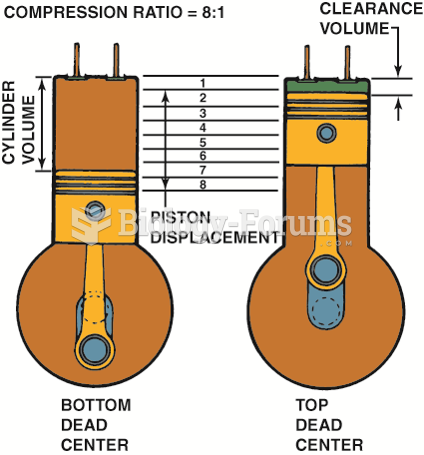 Compression ratio is the ratio of the total cylinder volume (when the piston is at the bottom of ...
 Demographic Data for Nigeria
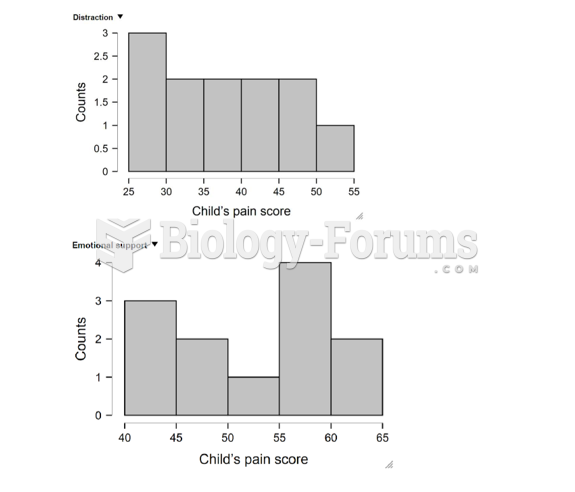 Histograms