This topic contains a solution. Click here to go to the answer
|
|
|

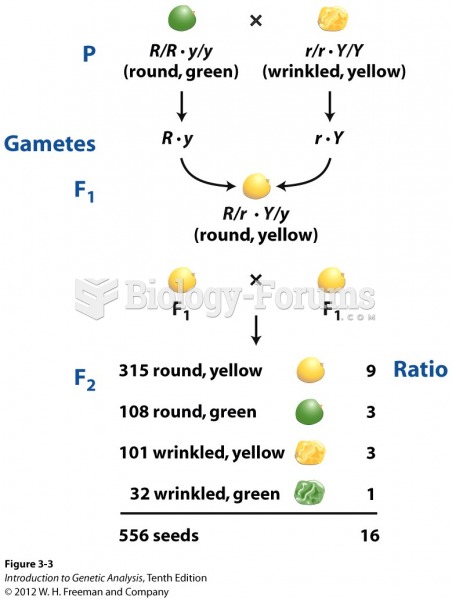 Mendel's breeding program that produced a 9 : 3 : 3 : 1 ratio
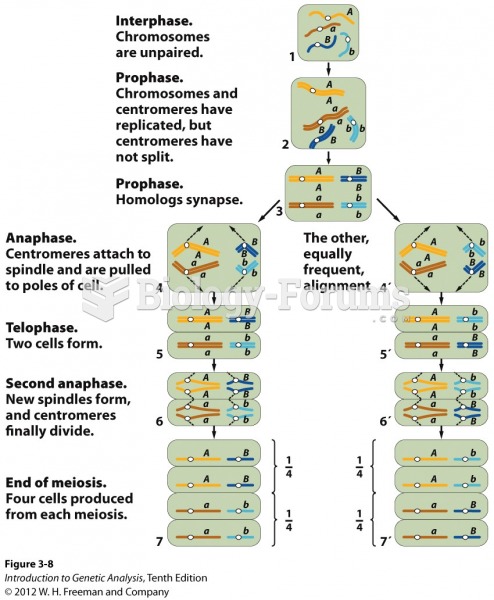 Independent assortment of chromosomes at meiosis explains Mendel’s ratio
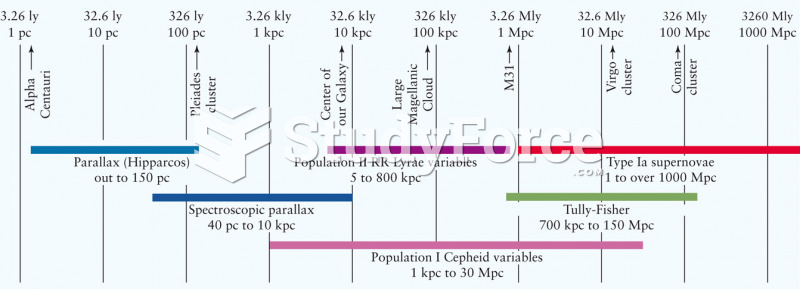 Techniques for Measuring Cosmological Distances
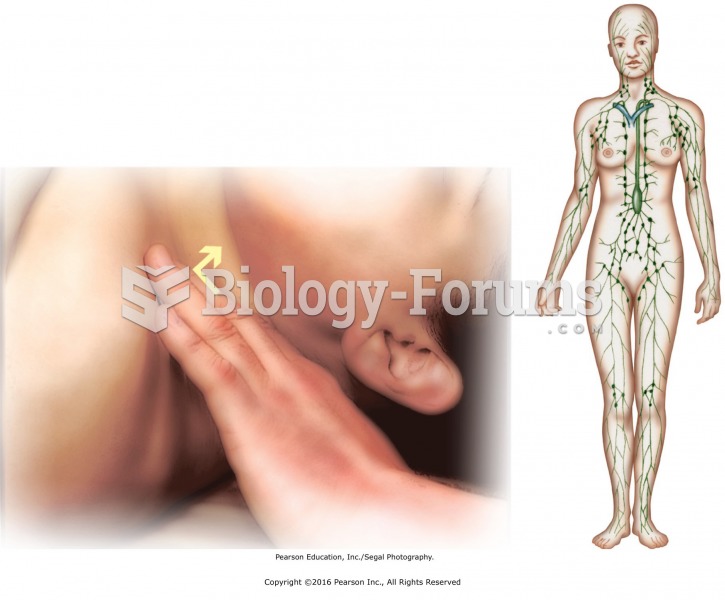 Lymphatic massage techniques improve the circulation of lymph fluid.
 Histograms
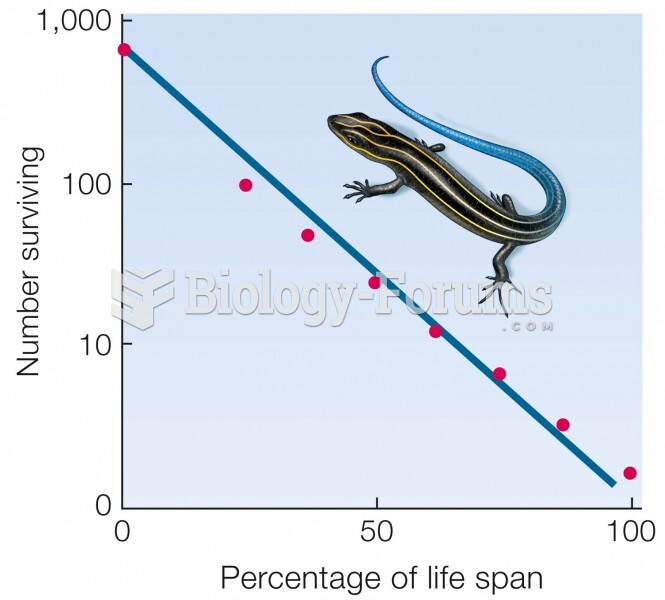 Type II curve. Mortality does not vary with age. Data for five-lined skink (Eumeces fasciatus).