This topic contains a solution. Click here to go to the answer
|
|
|

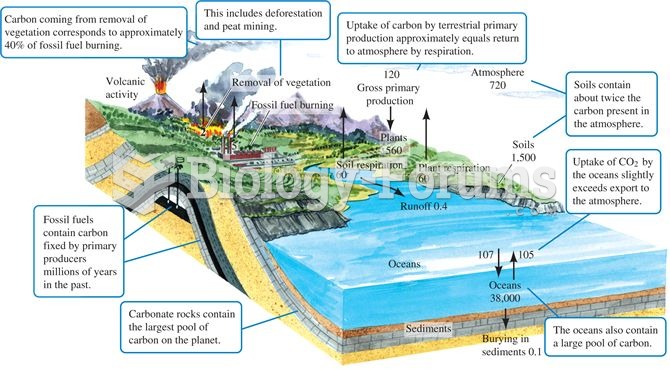 The carbon cycle. Numbers are storage as 1015 g or fluxes as 1015 g per year (data from Schlesinger
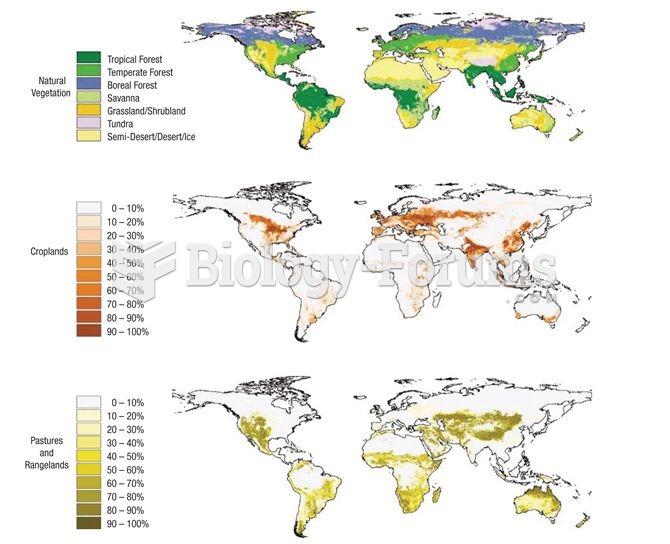 Extent of agricultural activity across the planet (data from Foley et al. 2005).
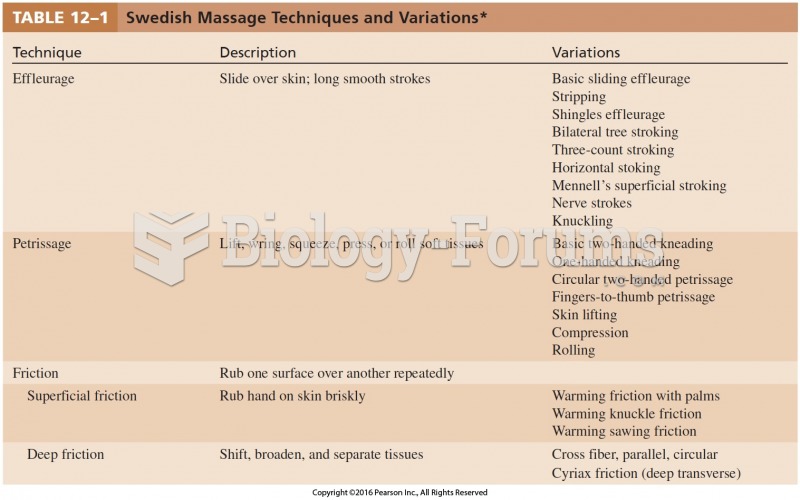 Swedish Massage Techniques and Variations
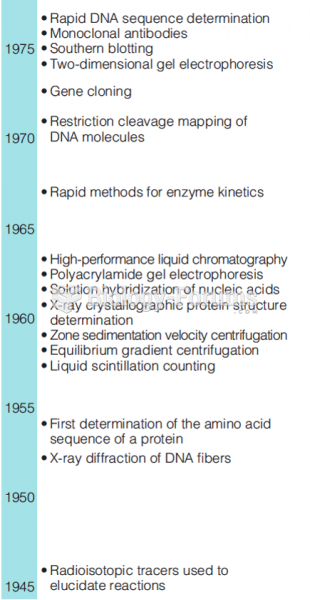 Recent history of biochemistry shown by the introduction of new techniques. (part 1)
 Data Used to Analyze Productivity in Country 1 and Country 2
 Basic Marketing Research: Using Microsoft Excel Data Analysis