This topic contains a solution. Click here to go to the answer
|
|
|

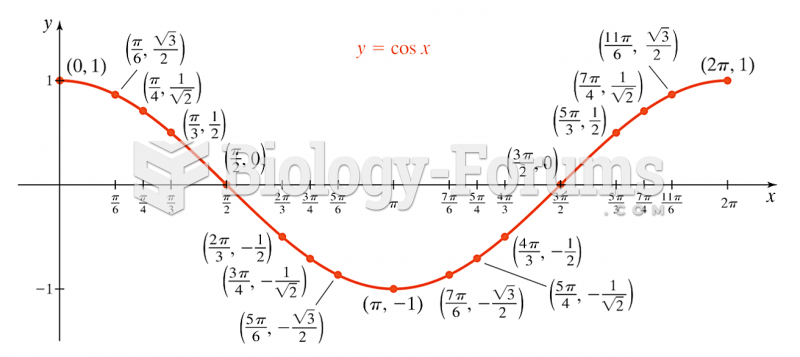 Graph of cos(x)
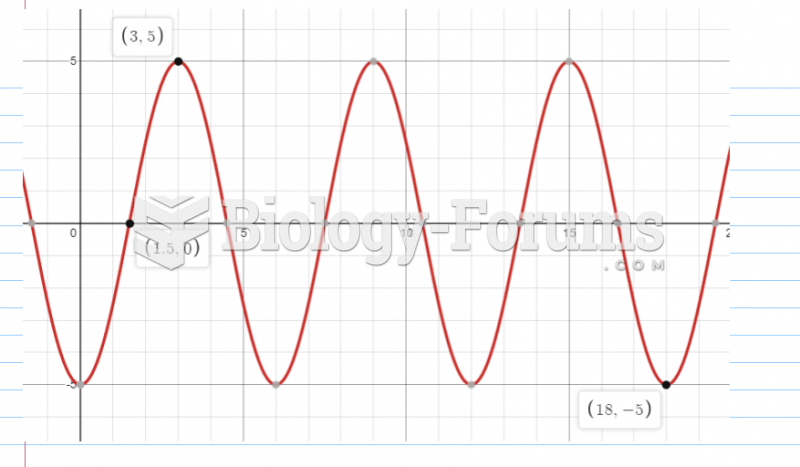 Sketch a graph of the function h(x), by hand on the following interval:
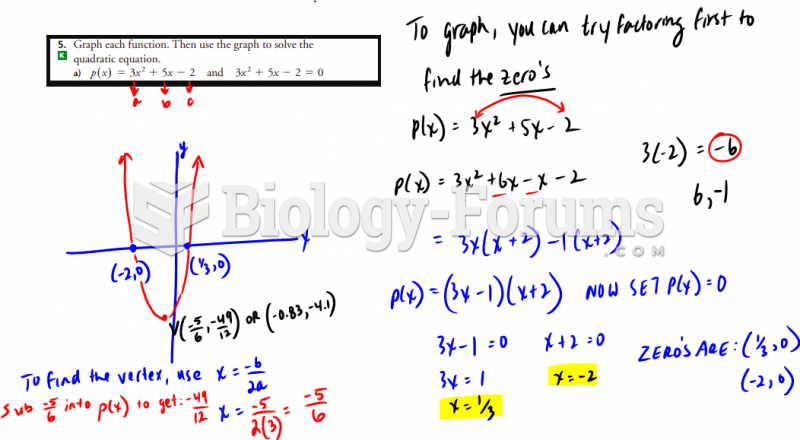 Graph this quadratic funcPLtion
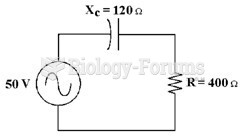 If the frequency equals 60 Hz in Figure 10-1, what is the value of capacitance?
 Finding the graph of a Parabola using certain values
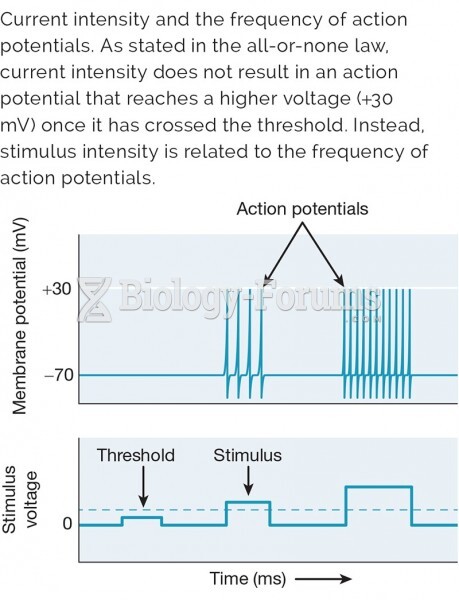 Current intensity and the frequency of action potentials