This topic contains a solution. Click here to go to the answer
|
|
|

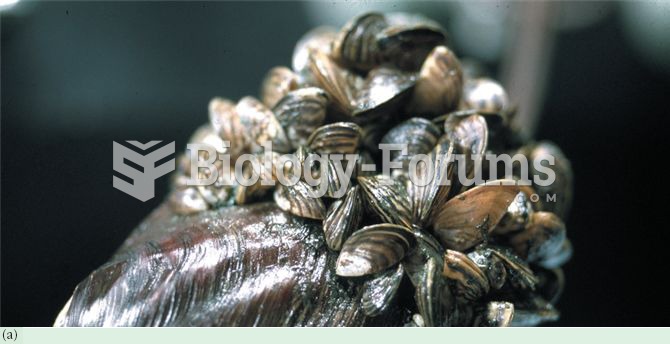 Invasive species in Canada include (a) zebra mussels, Dreissena polymorpha, (b) sea lamprey, Petromy
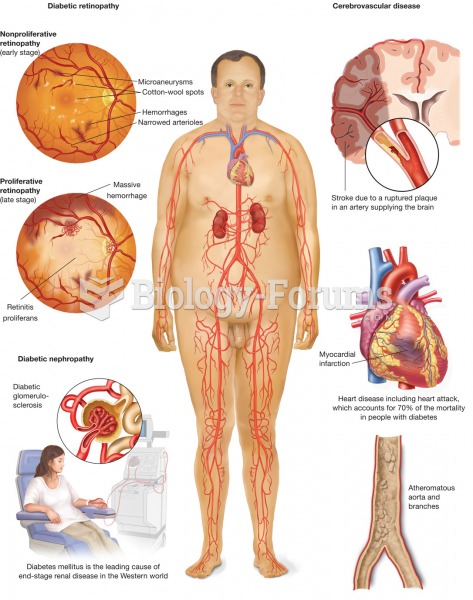 Diabetes mellitus. The metabolic disease diabetes mellitus, with symptoms of polydipsia, polyuria, a
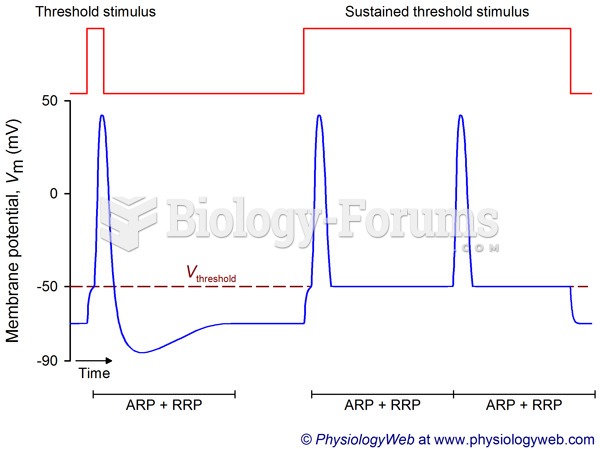 Frequency coding in the nervous system: Threshold stimulus.
 Normal oxygen sensor frequency is from about one to five times per second.
 Sketch the graph using the tables providing. Determine if each function is continuous or ...
 Change in the frequency of a lethal recessive allele, a