This topic contains a solution. Click here to go to the answer
|
|
|

 The tiger, Panthera tigris, was historically found throughout much of Asia, but at low population de
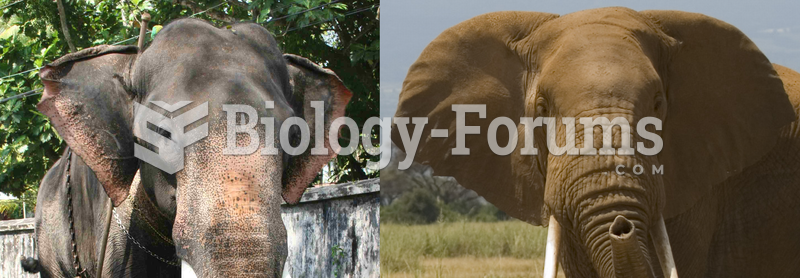 Difference between Asian (left) and African (right) elephant ears.
 study
study
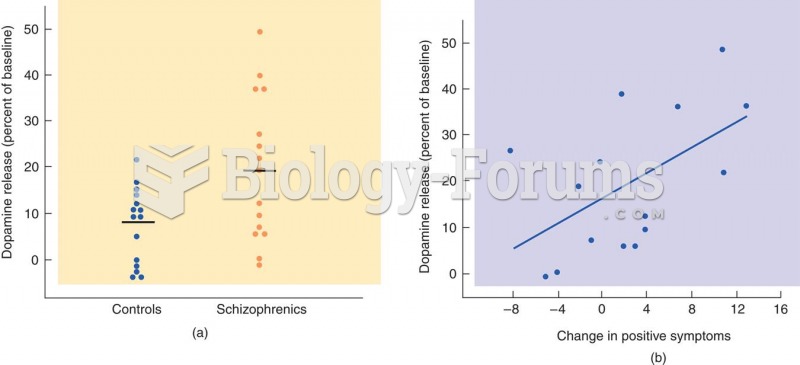 Results of the study by Laruelle et al. (1996)
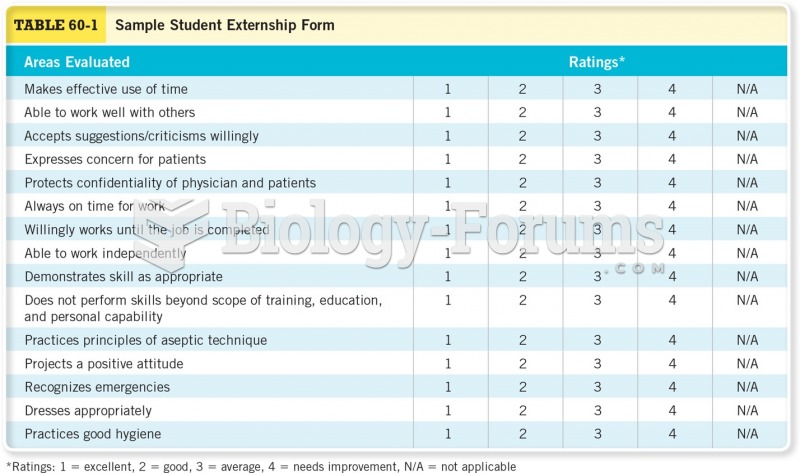 Sample Student Externship Form
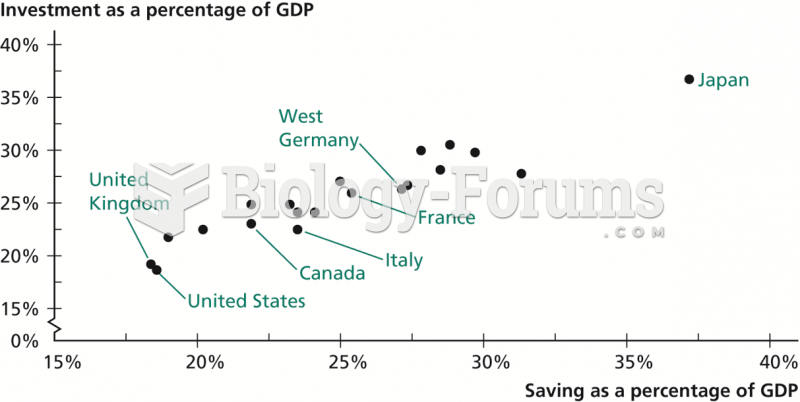 Saving and Investment Rates of Industrialized Countries, 1960–1974