|
|
|

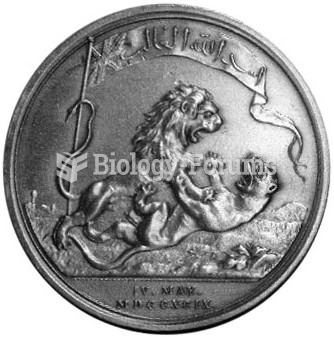 The Seringapatam medal shows a lion defeating a tiger
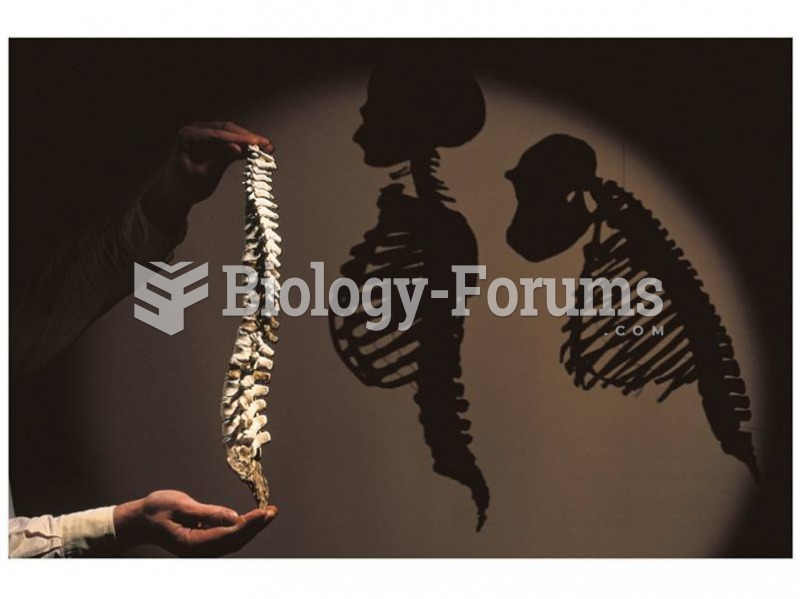 Reconstructed Australopithecus afarensis spine shows that species walked upright.
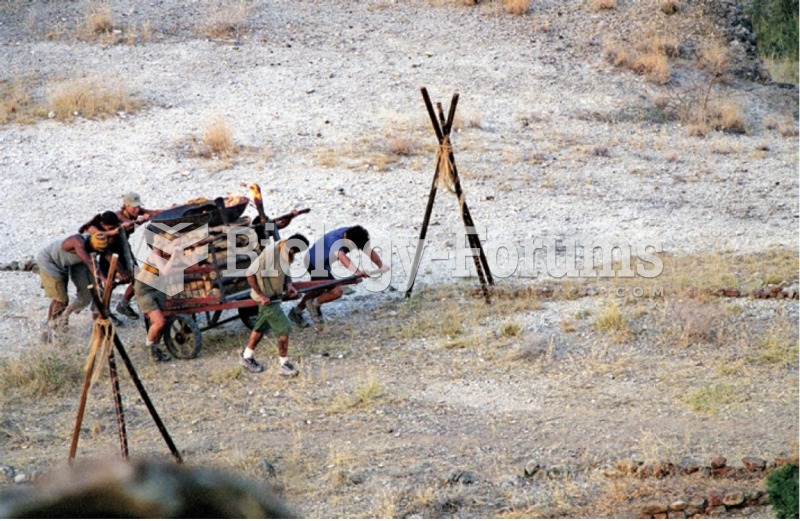 Are reality shows “real”? Does the media tell the “truth”?
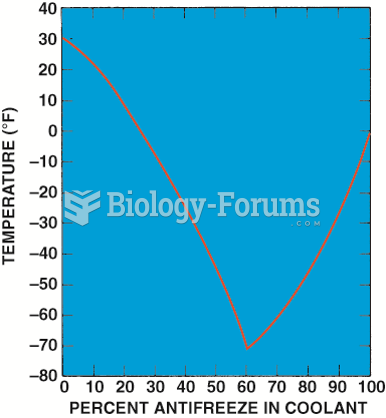 Graph showing the relationship between the freezing point of the coolant and the percentage of ...
 This label on a Toyota Camry hybrid shows the relative smog-producing emissions, but this does not ...
 Increased neurogenesis in the dentate gyrus following damage. The left panel shows (1) an ...