This topic contains a solution. Click here to go to the answer
|
|
|

 A Wave Machine Generating Electricity off the Coast of Portugal
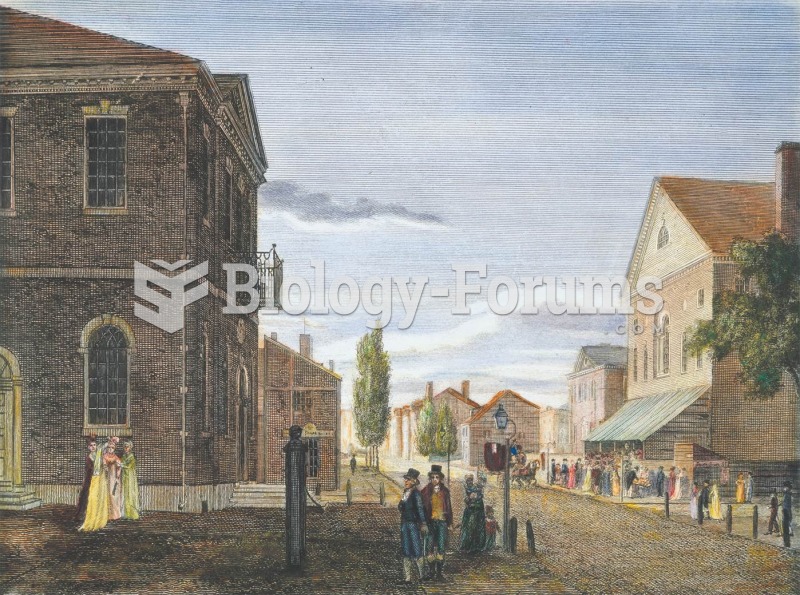 This engraving by William Russell Birch shows Congress Hall (left), which was occupied by Congress f
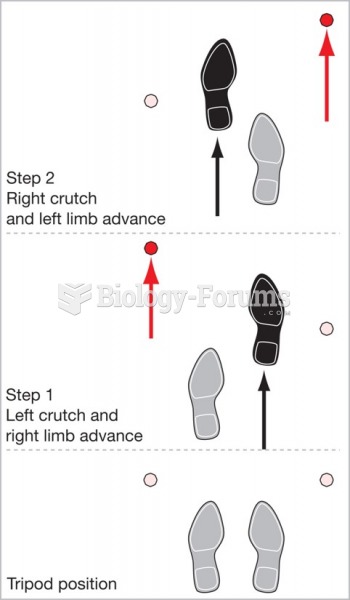 Two-point gait.
 In early capitalism, children worked alongside adults. At that time, just as today, most street ...
 Discrete random variables- Probability Distribution Function
 A mother invests $9000 in a bank account at the time of her daughter's birth. The interest is ...