This topic contains a solution. Click here to go to the answer
|
|
|

 A nurse shows empathy to a client.
 This red-bellied lemur shows clearly the traits that characterize strepsirhine primates.
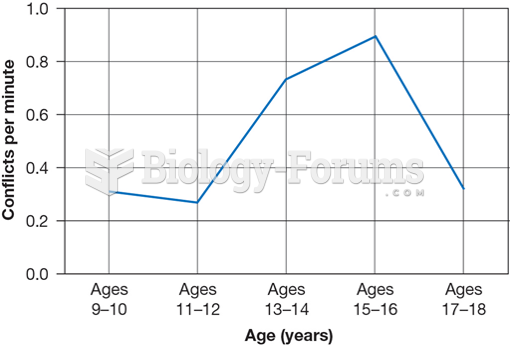 Observed Mother–Child Arguments at Five Time Points Over an Eight-Year Period
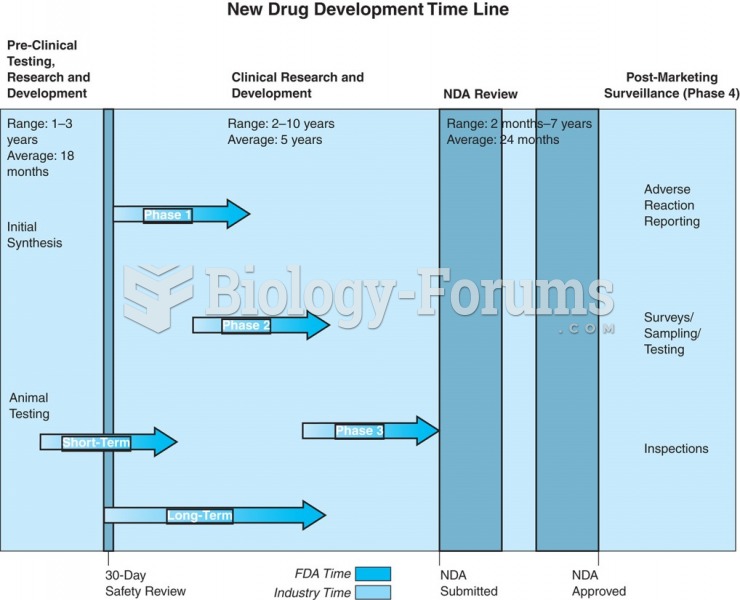 A new drug development time line with the four phases of drug approval.
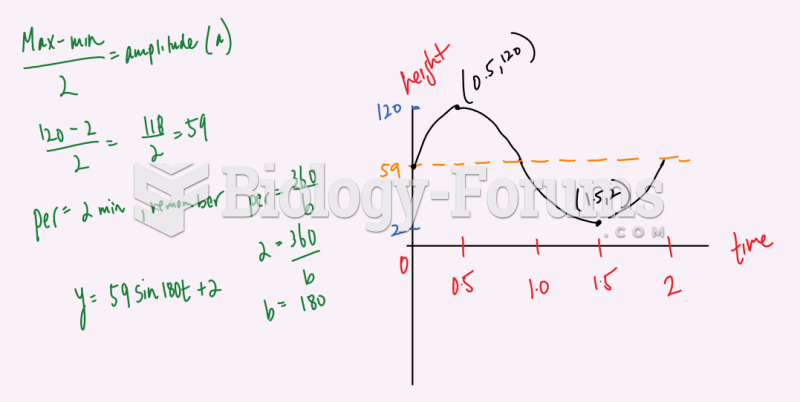 Periodic Function Modelled
 The figure shows an LR circuit with a switch and a 240-volt battery. At the instant the switch ...