This topic contains a solution. Click here to go to the answer
|
|
|

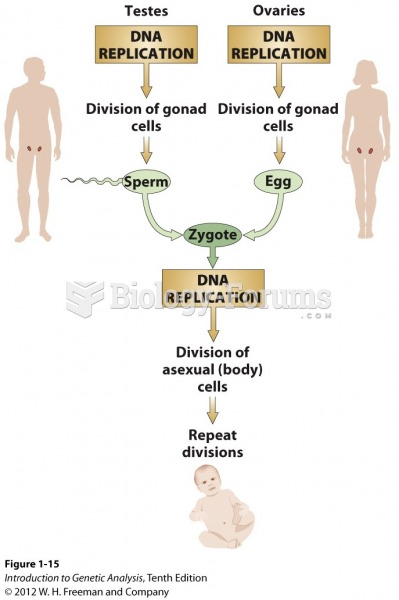 DNA replication is the basis for the perpetuation of life through time
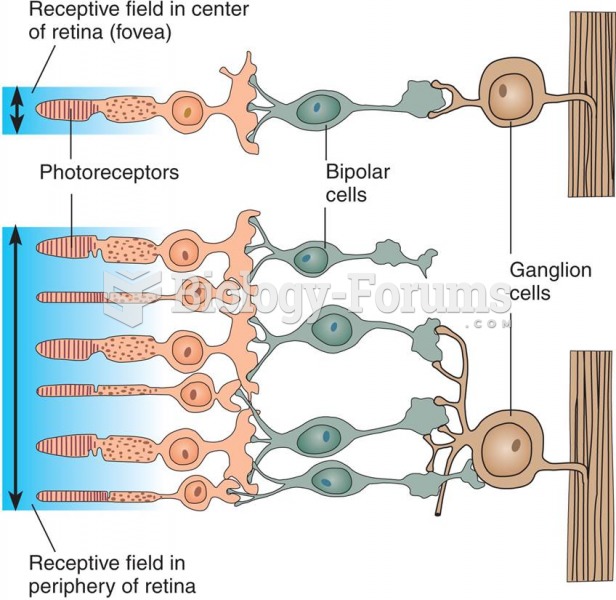 Foveal Versus Peripheral Acuity
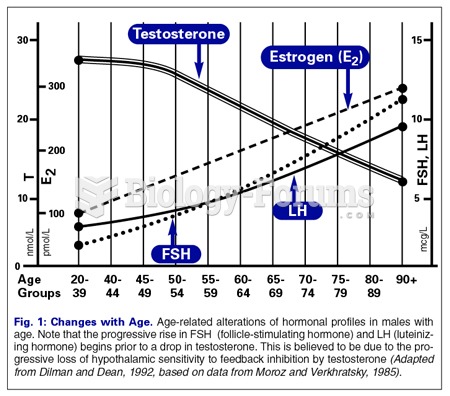 Estrogen versus testosterone in Males as they Age
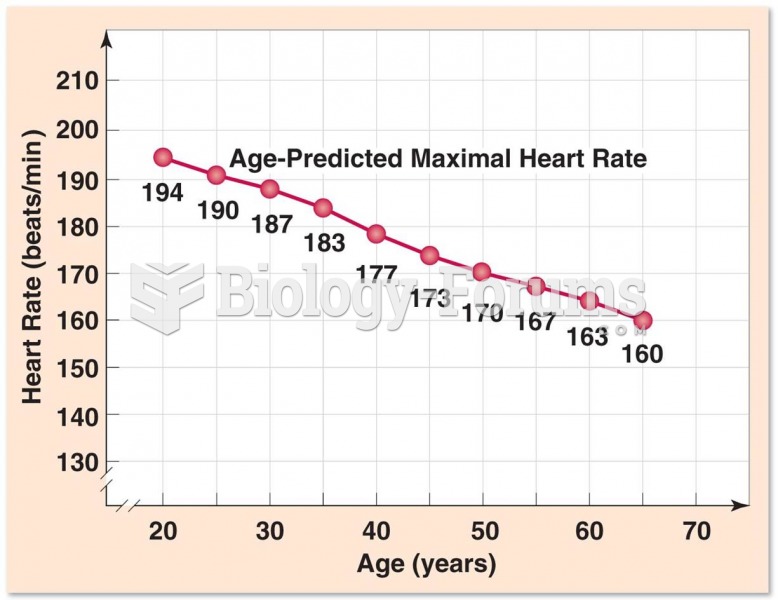 Maximal Heart Rate Over Time
 Older adulthood can be a time of independence and exploration as responsibilities diminish and the ...
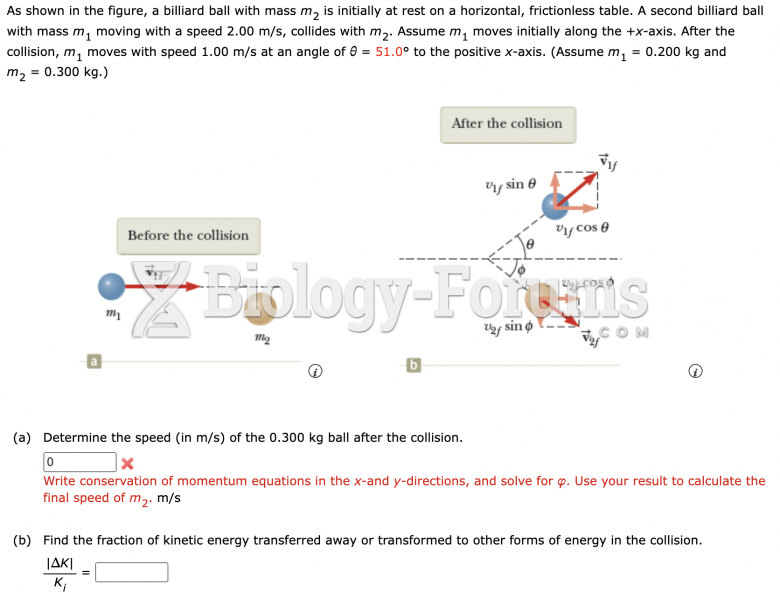 a billiard ball physics question