This topic contains a solution. Click here to go to the answer
|
|
|

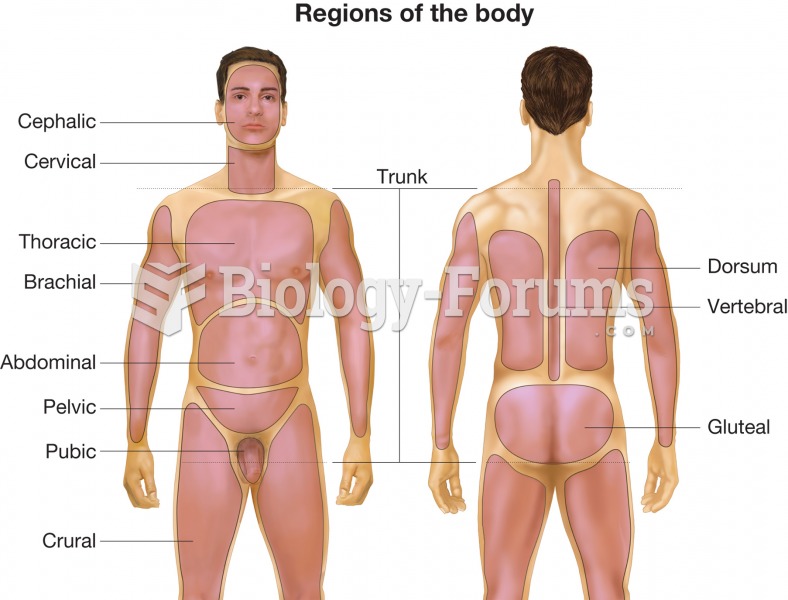 Anterior and posterior views of the body illustrating the location of various body regions.
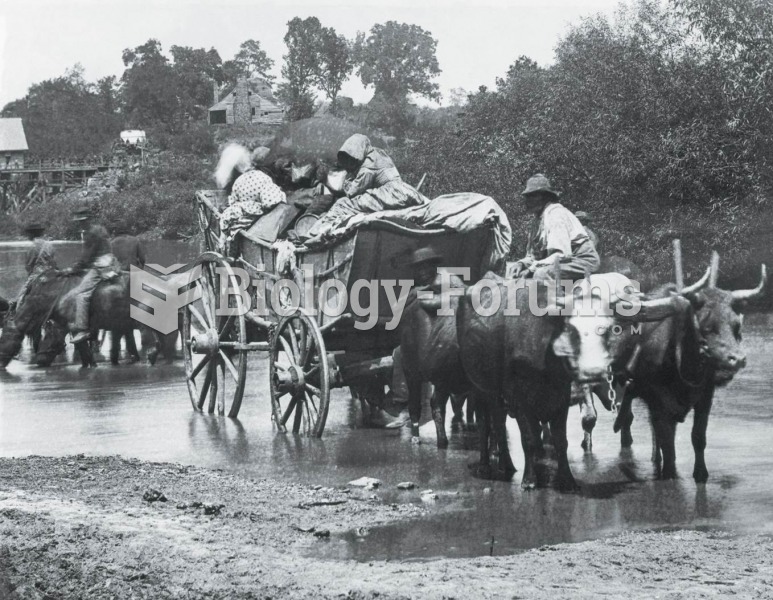 When Union troops pushed toward Richmond in June of 1862, these slaves crossed the Rappahannock Rive
 Michelangelo, "Atlas" Slave.
 Aggregates are people who happen to be in the same place at the same time.
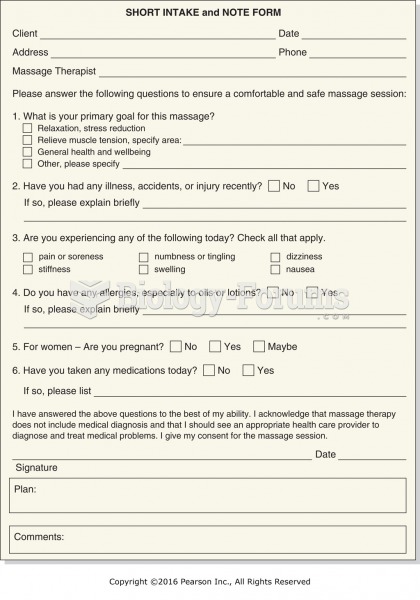 Example of simplified note for one-time client.
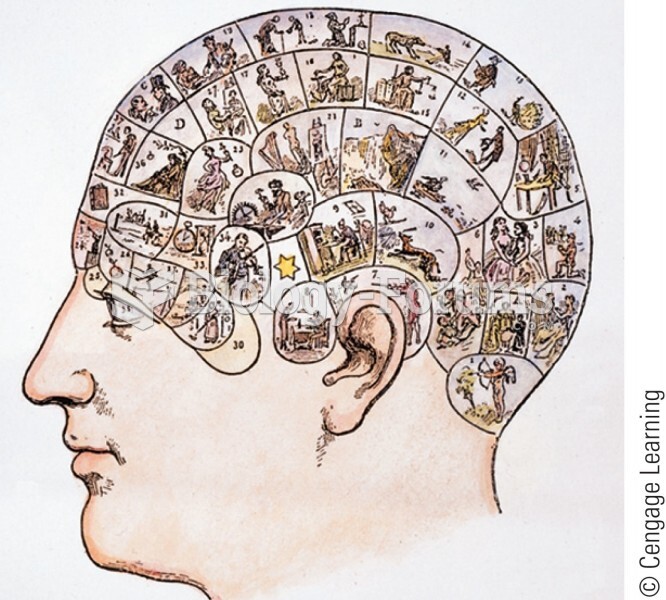 Phrenology model showing areas of the head overlaying brain regions that control different traits. I