This topic contains a solution. Click here to go to the answer
|
|
|

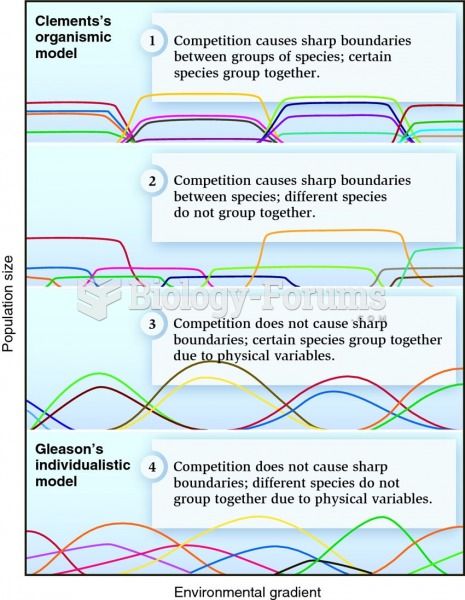 Four hypotheses on how populations might relate to one another along an environmental gradient.
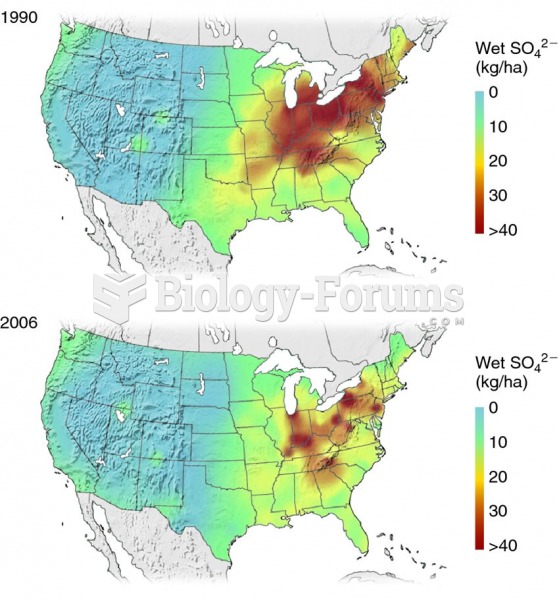 The extent of acid rain in the United States has decreased.
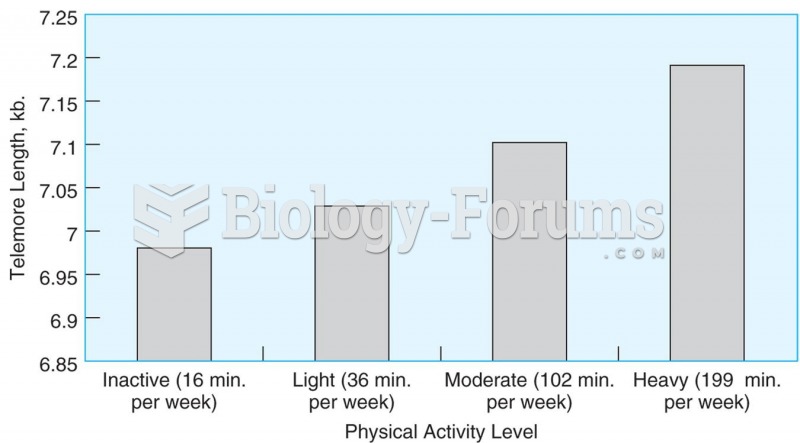 Telomere length is related to the amount of time adults spend in leisure time activity. Source: Ada
 Aggregates are people who happen to be in the same place at the same time.
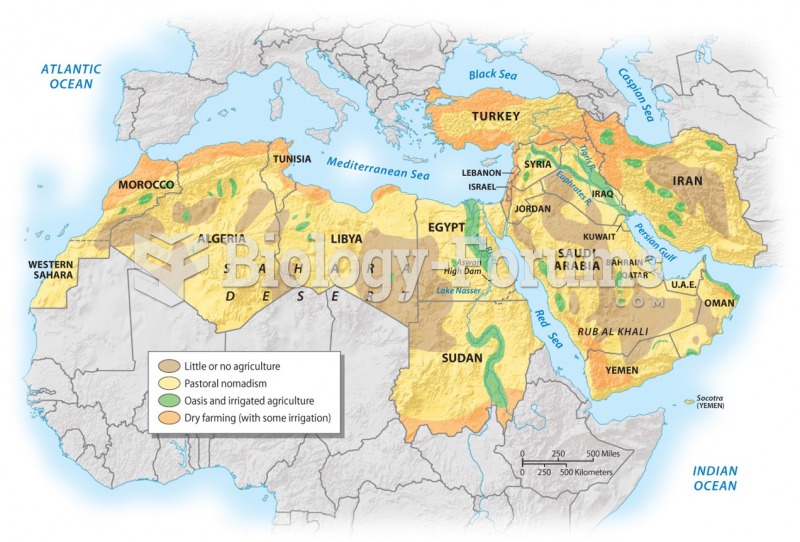 Agricultural Regions
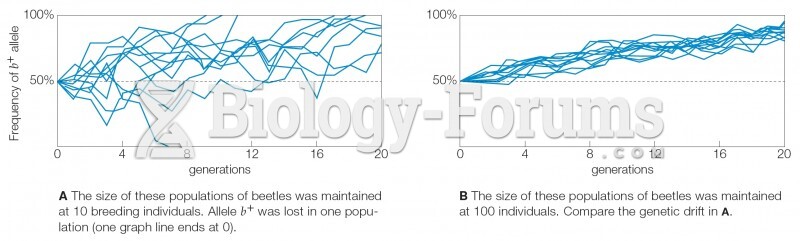 Genetic Drift in Large and Small Populations