This topic contains a solution. Click here to go to the answer
|
|
|

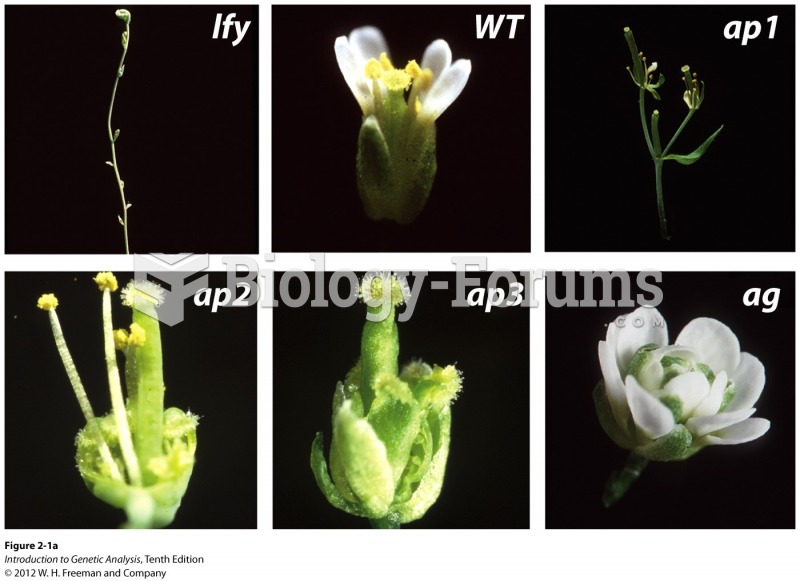 Genetic analysis begins with mutants
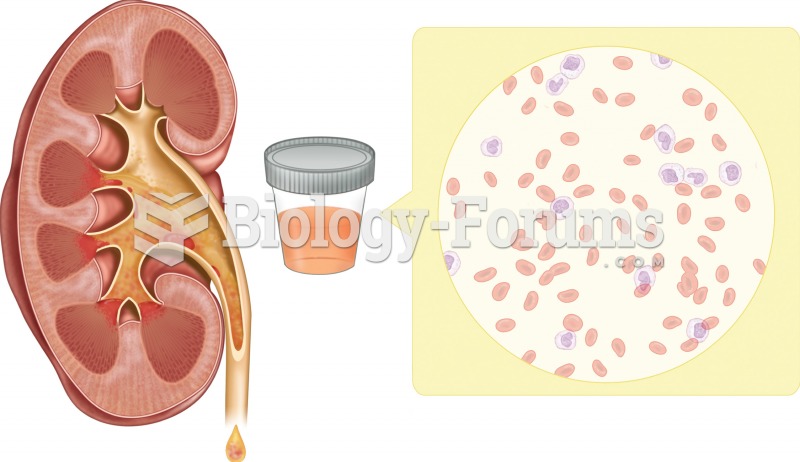 Hematuria. An analysis of urine is performed to evaluate kidney function. In this illustration, the
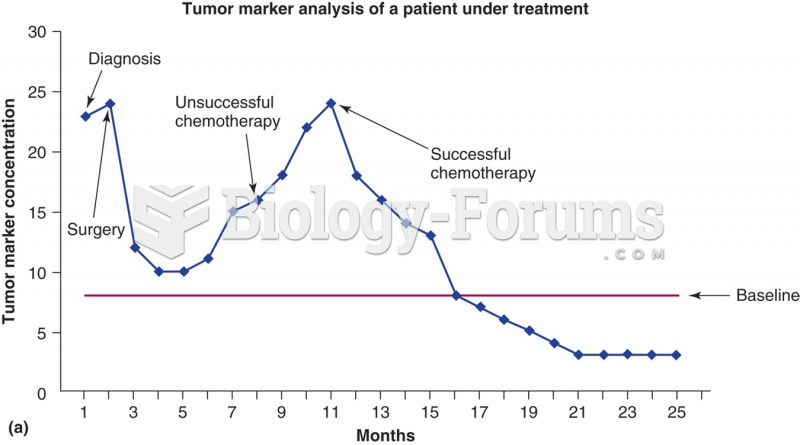 Tumor marker analysis of a patient undergoing therapy, who (1) after surgery had residual disease ...
 GENETIC ANALYSIS
 Genetic interactions identified through synthetic lethal analysis
 An example of identification and analysis of conditional alleles