|
|
|

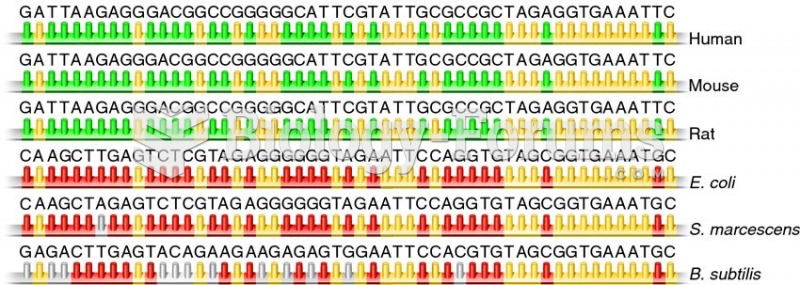 Comparison of small subunit rRNA gene sequences from three eukaryotes and three bacterial species
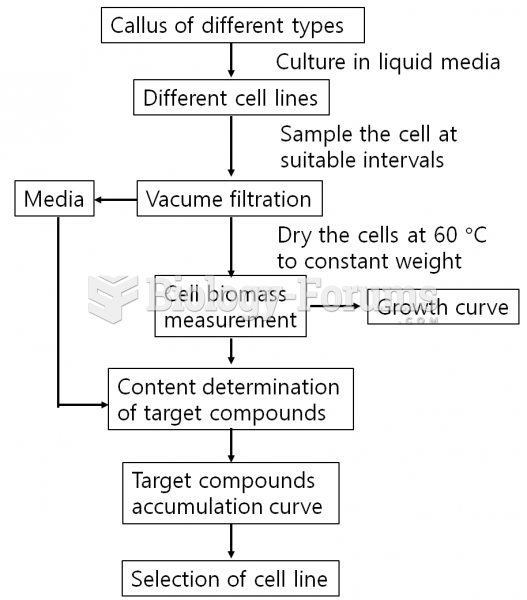 cell line selection
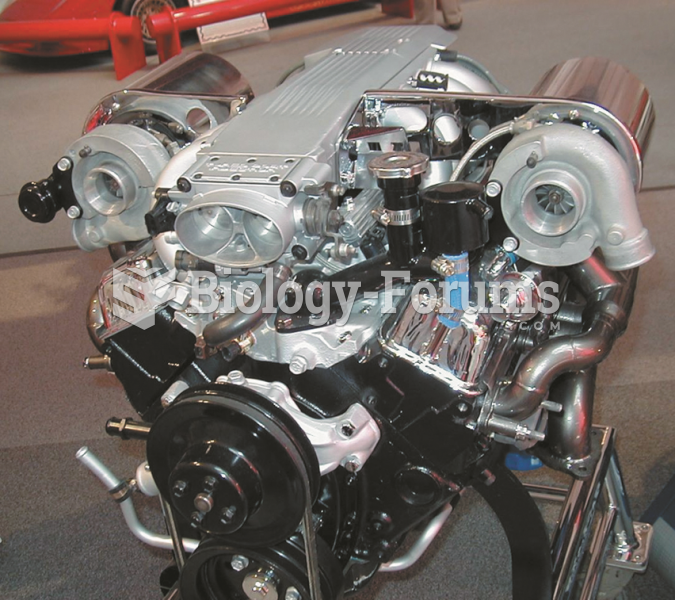 A dual turbocharger system installed on a small block Chevrolet V-8 engine.
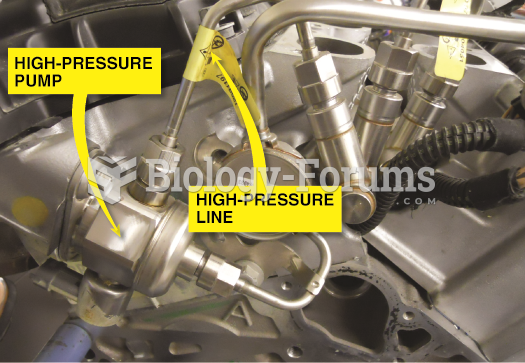 The line that has the yellow tag is a highpressure line and this line must be replaced with a new ...
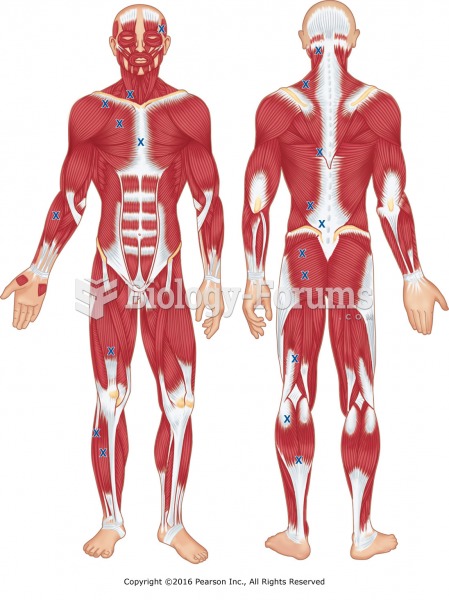 Common trigger point locations, anterior and posterior.
 The slope of the curve y = ax^3 - bx^2 + cx - 3 at x = 2 is 5. If the point of inflection of the cur