|
|
|

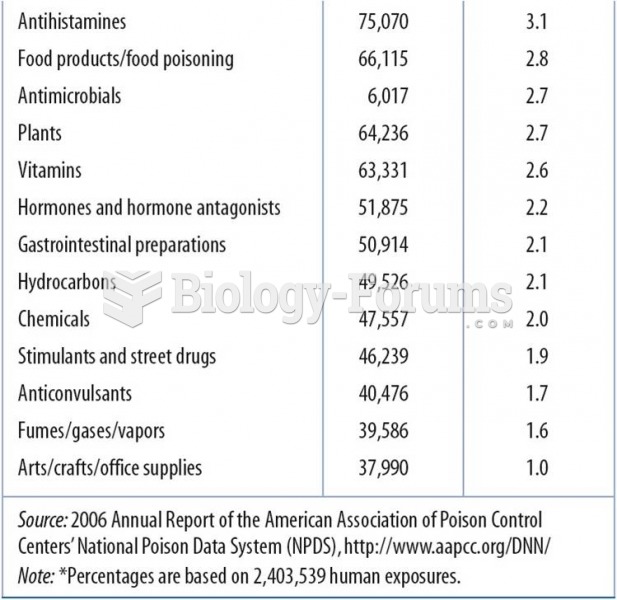 2006 Data:Top 25 Substances Involved in Human Exposures
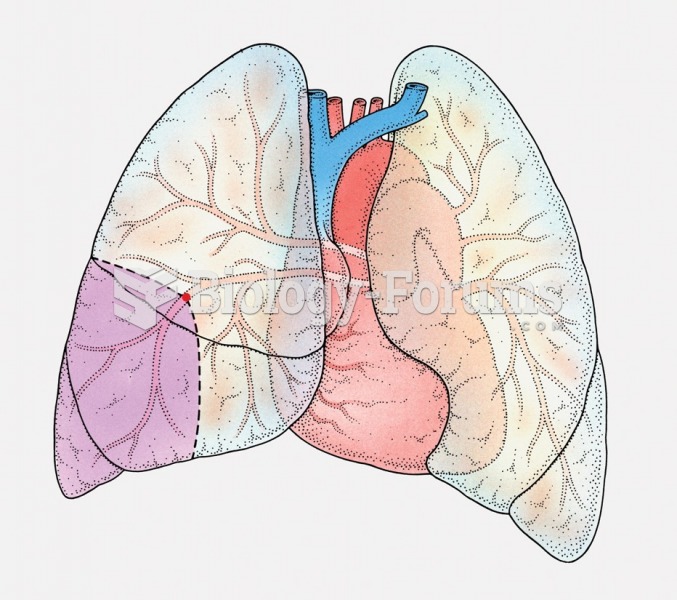 Pulmonary embolism. The purple shaded section shows the area of the lung that is dying from lack of ...
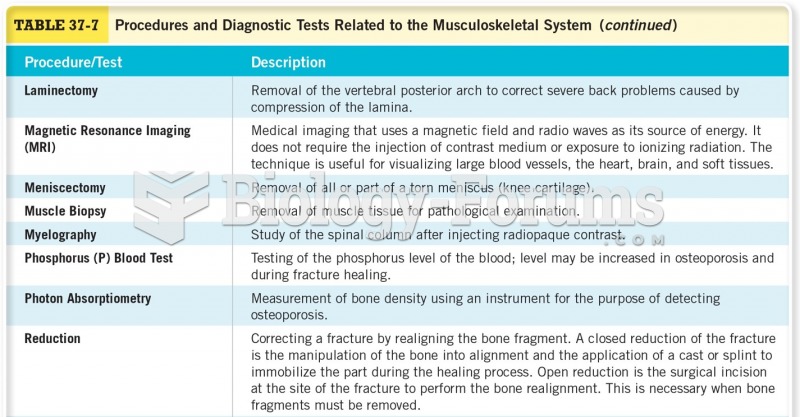 Procedures for Diagnostic Tests Related to the Musculoskeletal system
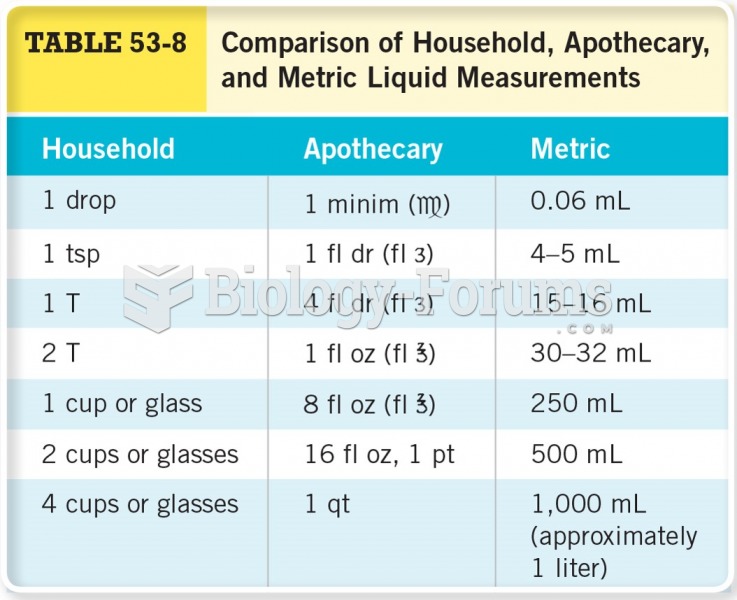 Comparison of Household, Apothecary, and Metric Liquid Measurements
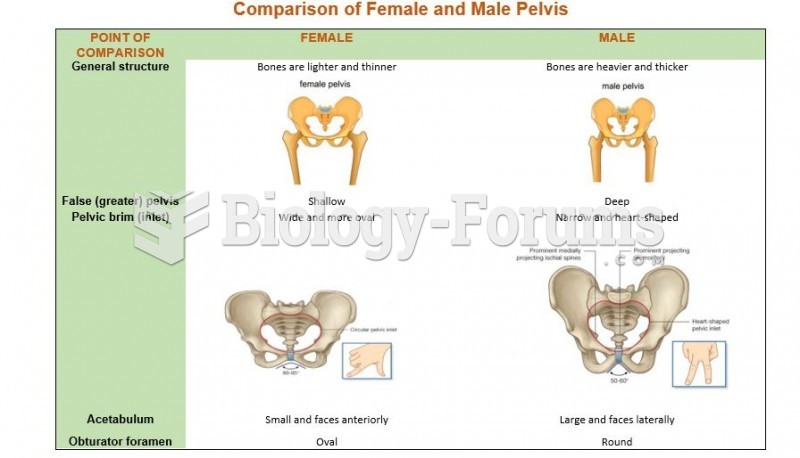 Comparison of Female and Male Pelvis
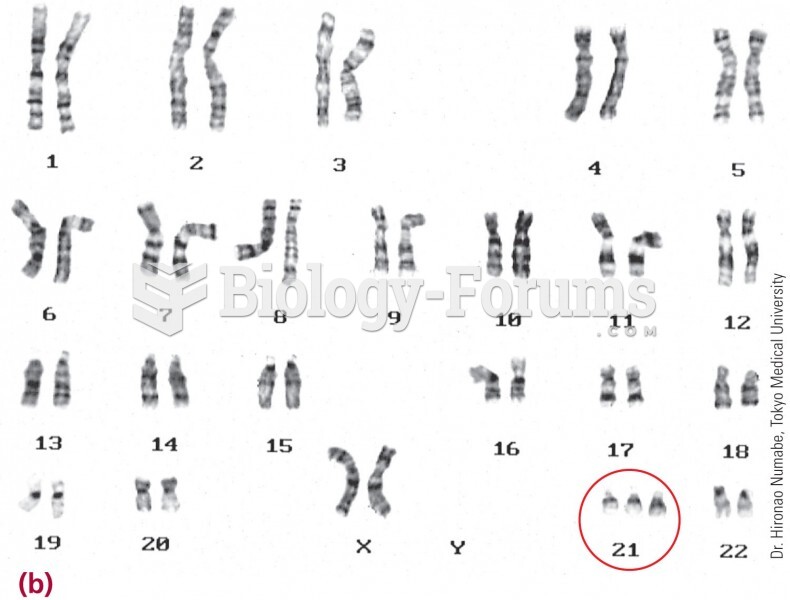 A karyotype shows this child has three copies of chromosome 21.