This topic contains a solution. Click here to go to the answer
|
|
|

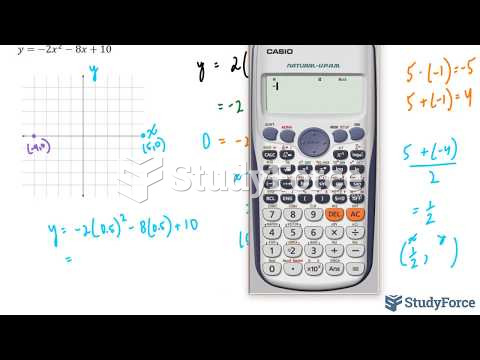 How to sketch a quadratic equation that is in standard form (Question 2)
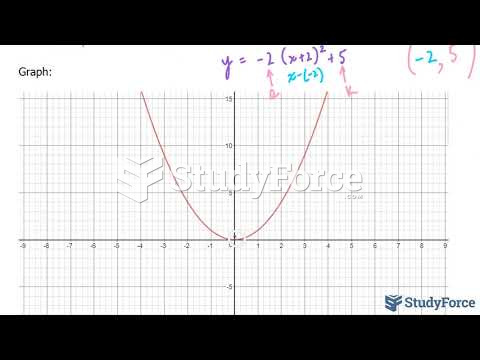 How to sketch a quadratic equation using transformations after completing the square (Question 2)
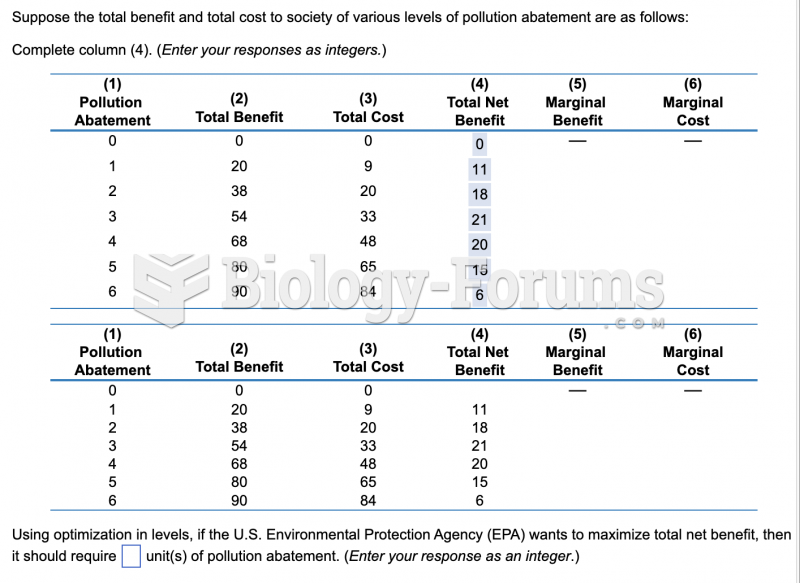 economic question
 economic question
 economic question (having trouble)
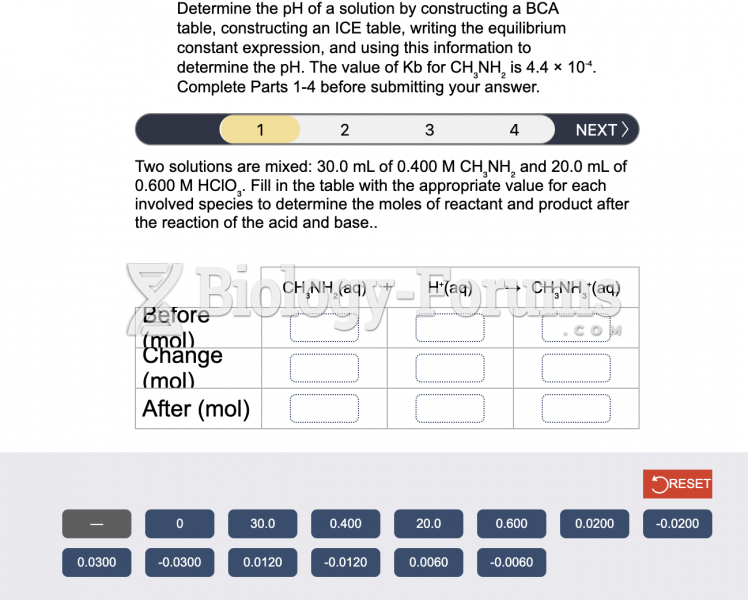 Chemistry question