This topic contains a solution. Click here to go to the answer
|
|
|

 Laboratory Requisition Information
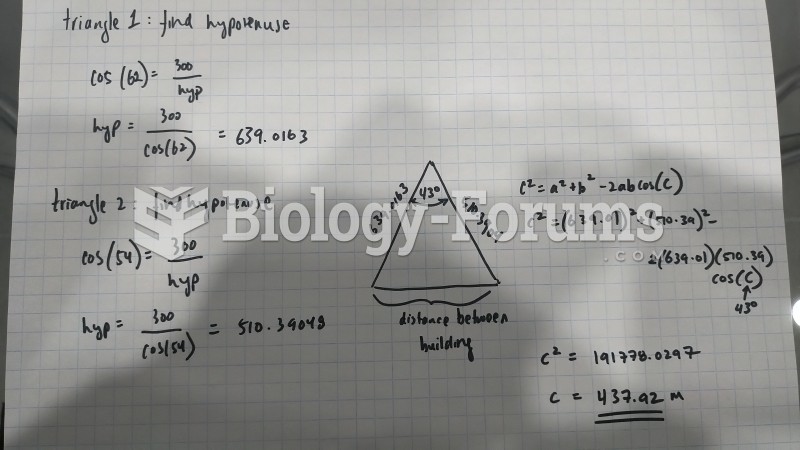 Answer to Trig problem
 Biology Question
 economic question
 economic question
 economic question (having trouble)