This topic contains a solution. Click here to go to the answer
|
|
|

 Demonstrate the Application of Triangular, Figure-Eight, and Tubular Bandages
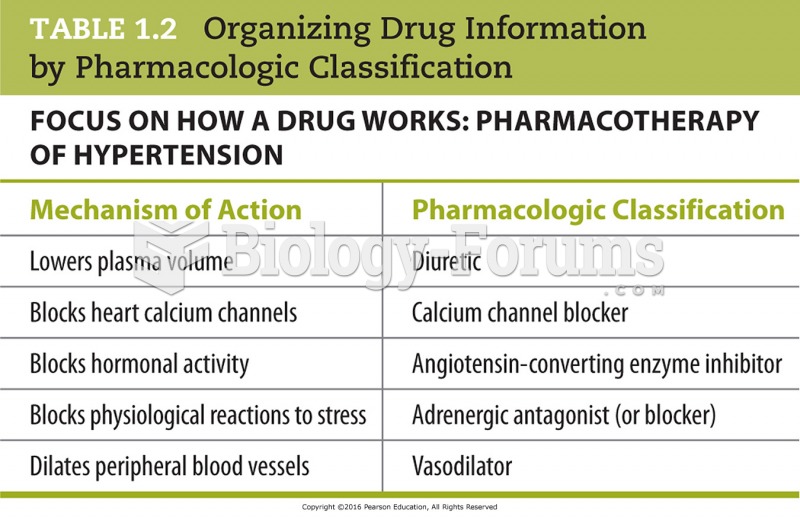 Organizing Drug Information by Pharmacologic Classification
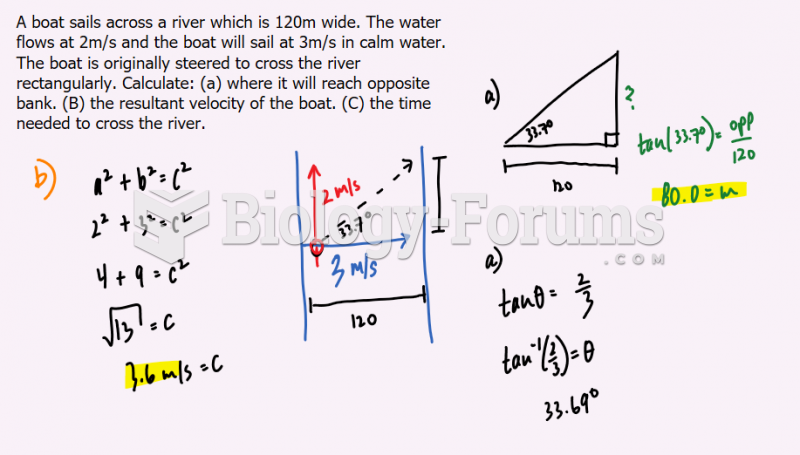 Answer to Vector Question Pt. 1
 economic question
 economic question
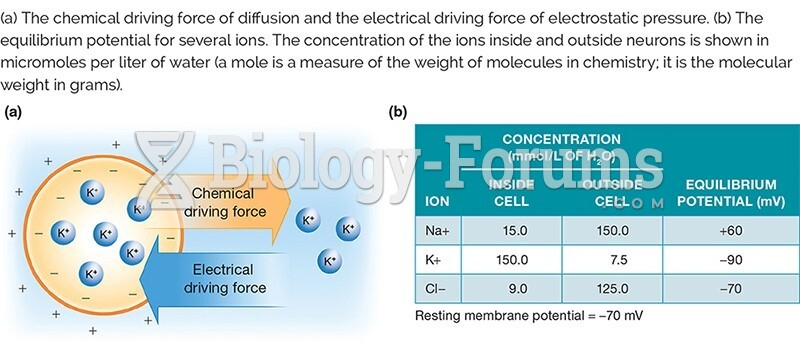 Figure 2.15.jpg