This topic contains a solution. Click here to go to the answer
|
|
|

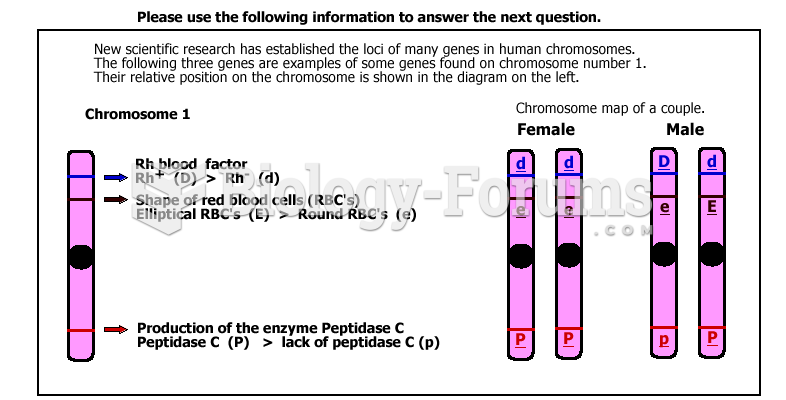 Chart to answer QN
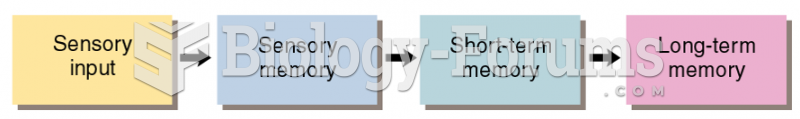 A Simplified Model of Information Flow in Human Memory
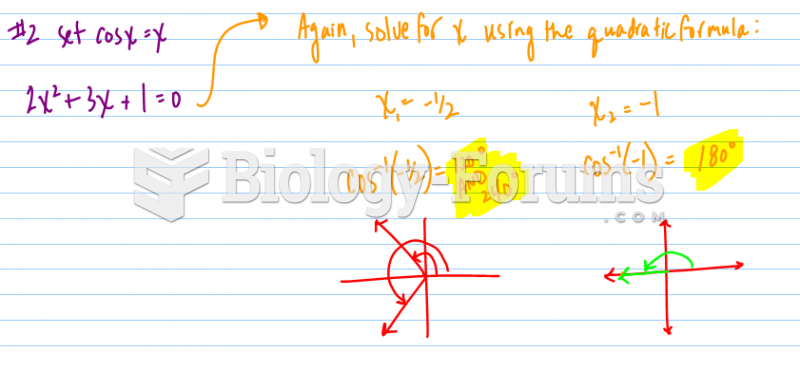
 How to evaluate third-order determinants by Minors Method (Question 2)
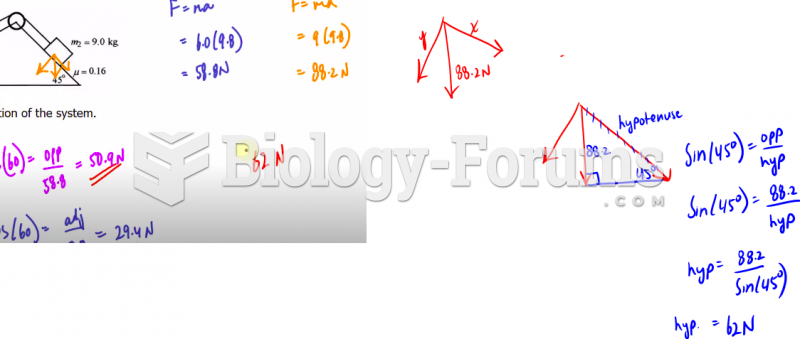 Answer to physics question from Youtube
 Answer to trig solving
 economic question