This topic contains a solution. Click here to go to the answer
|
|
|

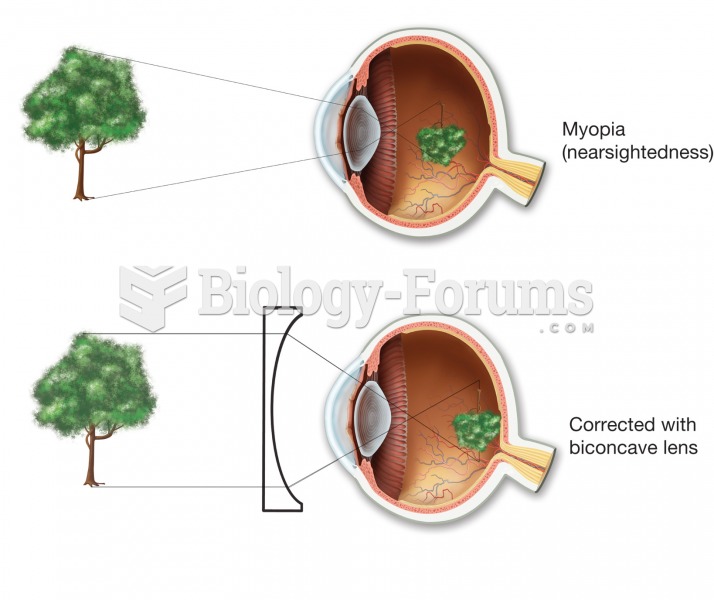 Myopia (nearsightedness). In the uncorrected top figure, the image comes into focus in front of the
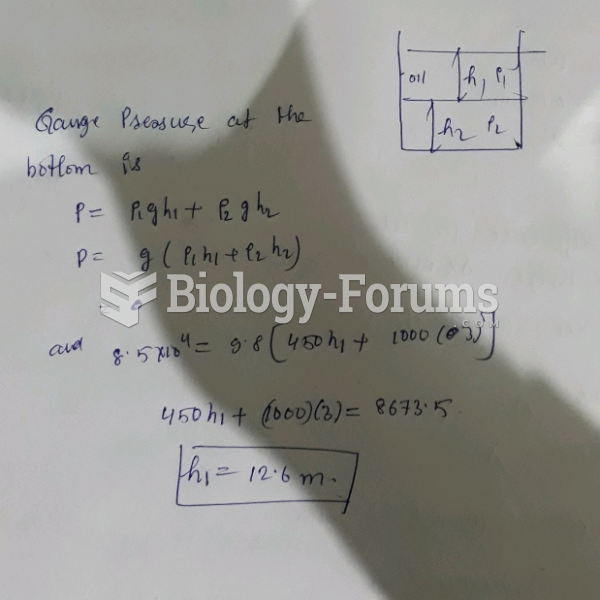 As shown in the figure, a large open tank contains a layer of oil ( density 450 kg/m3) floating ...
 Economics question
 economic question
 economic question
 economic question