This topic contains a solution. Click here to go to the answer
|
|
|

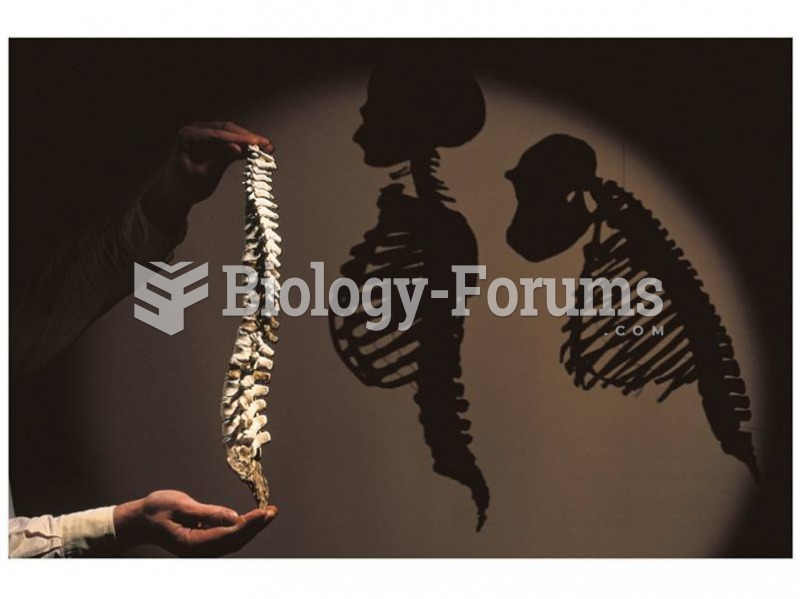 Reconstructed Australopithecus afarensis spine shows that species walked upright.
 In 2008, the U.S. economy suffered a gaping wound as several trillion dollars were ripped out of it.
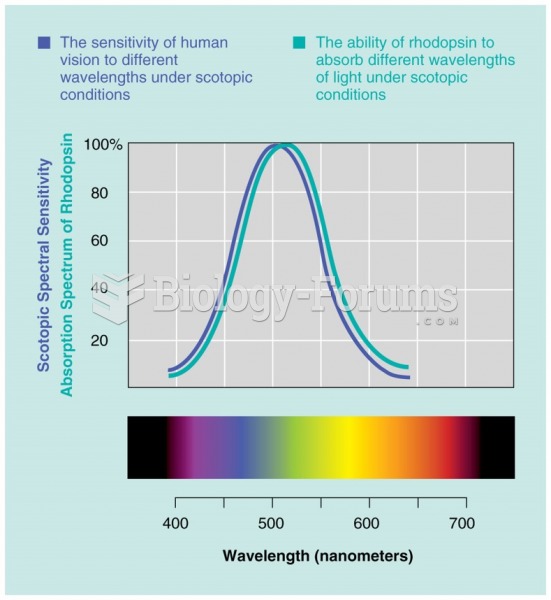 The adsorption spectrum of rhodopsin compared with the human scotopic spectral sensitivity curve.
 Use two hands to squeeze both sides of the arm at the same time. Apply from shoulder to wrist. ...
 Disitive Time For Potatoes
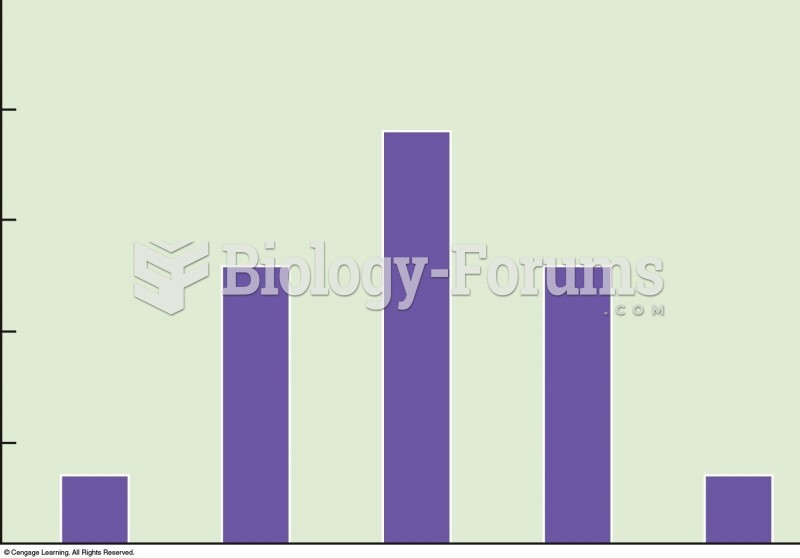 Frequency distribution of phenotypes from the possible offspring in Figure 5.7. Height of the offspr