This topic contains a solution. Click here to go to the answer
|
|
|

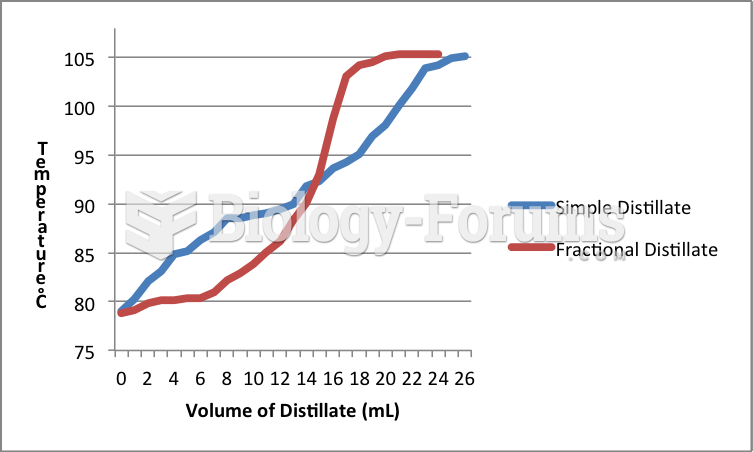 Distillation Graph Comparision
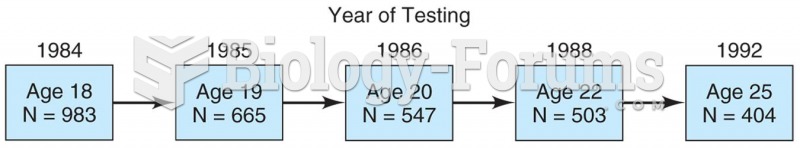 Model of a longitudinal study in which 983 students were surveyed in 1984 and then again in 1985, 19
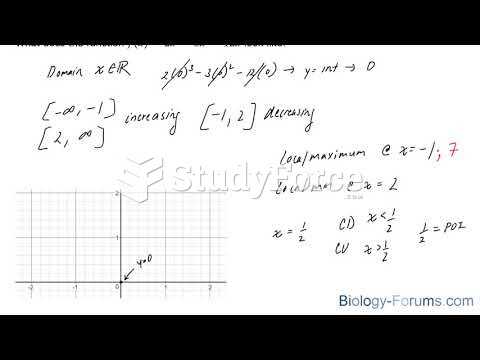 How to sketch a graph of a function using calculus only (Part 3)
 A mobile weather station that can be used to gather current weather data at the scene of hazardous ...
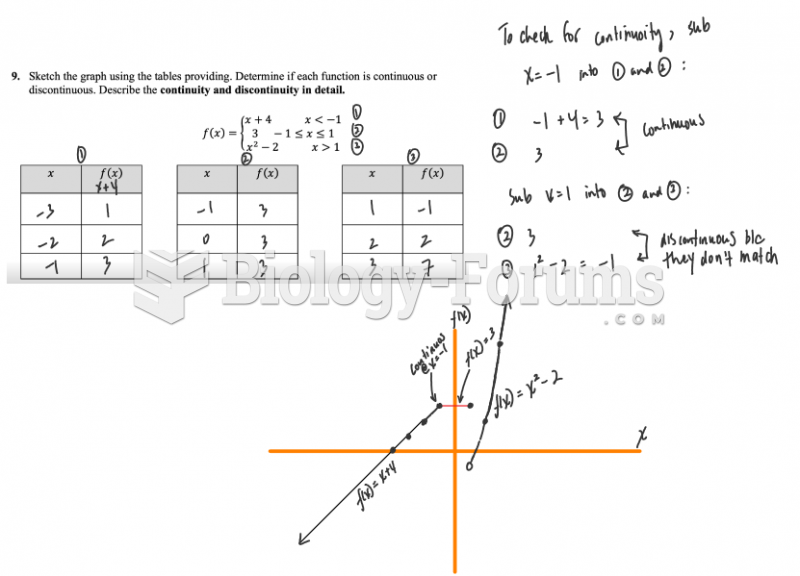 Sketch the graph using the tables providing. Determine if each function is continuous or ...
 Data for a Hypothetical Paternity Test Using 13 CODIS Genes