Question 1
A manufacturing plant has created the following forecast and would like to apply a graphical aggregate planning method. Complete the table and calculate the difference between Jan.'s forecast demand per working day vs a level production model for the entire period?
Month | Expected Demand | Production Days | Demand per Day (to the nearest whole unit) |
| Jan. | 1800 | 22 | |
| Feb. | 1400 | 18 | |
| Mar. | 1600 | 21 | |
Question 2
A hotel chain is considering using yield management to increase profits. Its plan is to sell unsold rooms at a discounted rate very close to the night of stay. For example, an unsold Friday night room would be discounted early in the week. It estimates that the percentage of sold rooms (total) would be equal to 50 + X, where X is the % discounted off of regular price. Meanwhile the % of rooms sold for full price compared to the discount would be 100 - 2X (some people would wait to book gambling a discount would happen). Find the ideal discount %.

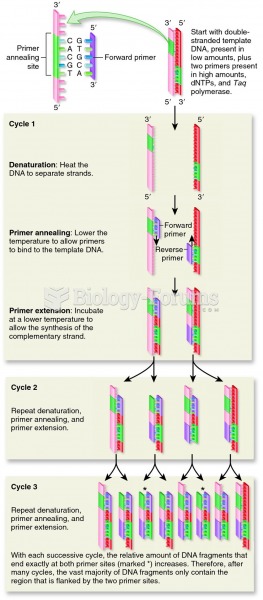 Polymerase chain reaction (PCR)
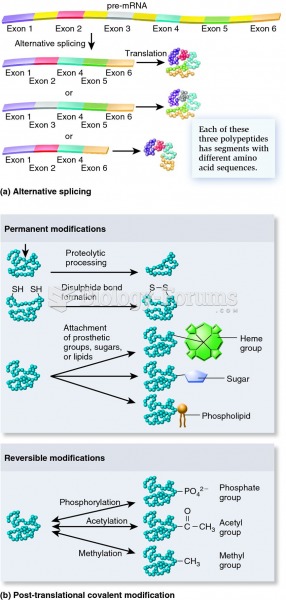 Cellular mechanisms that increase protein diversity
 Rules of Impression Management
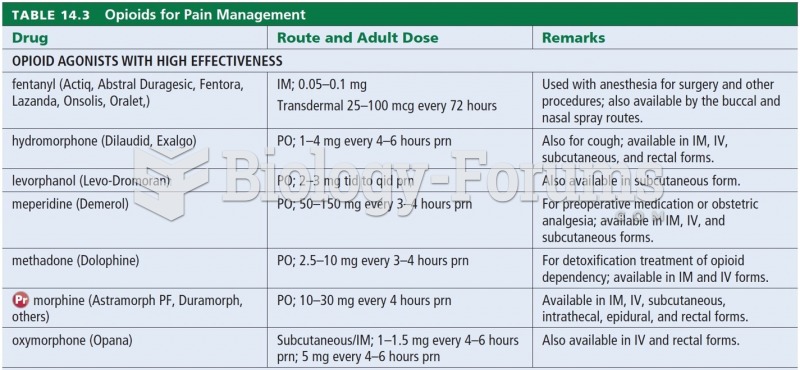 Opioids for Pain Management
 Project Management: Achieving Competitive Advantage, 5th Edition
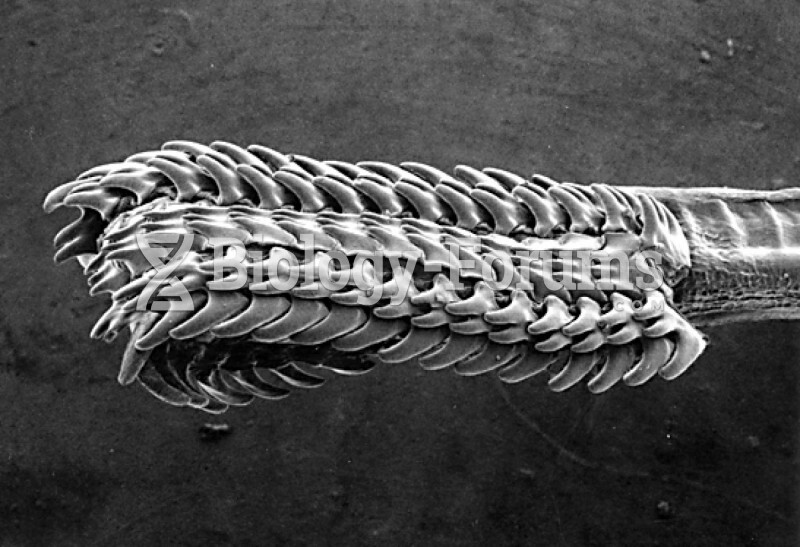 Body plan of an aquatic snail and micrograph of a radula