This topic contains a solution. Click here to go to the answer
|
|
|

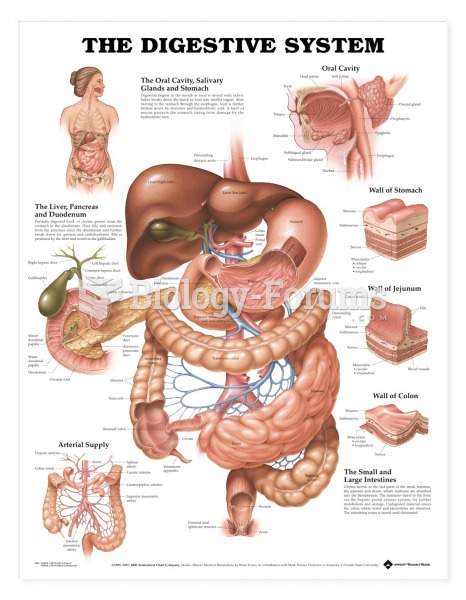 Anatomical Charts Digestive System
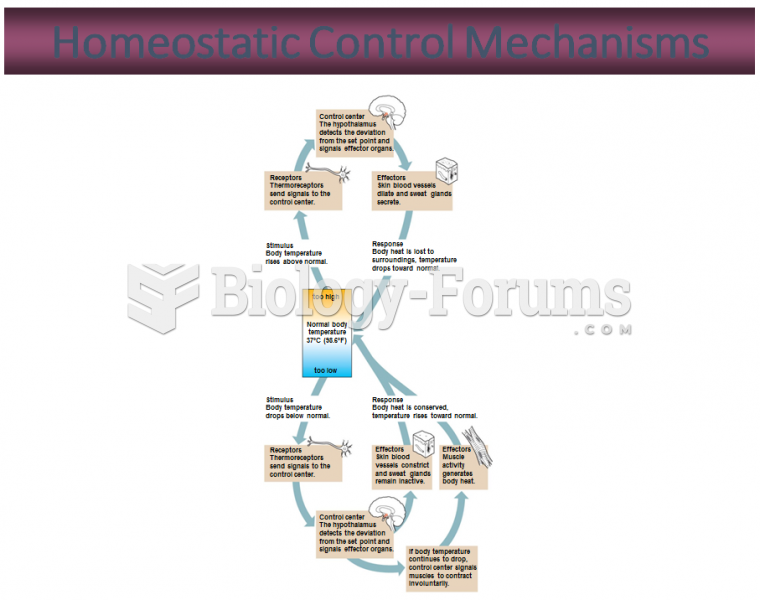 Homeostatic Control Mechanisms
 Sample Medicare identification card.
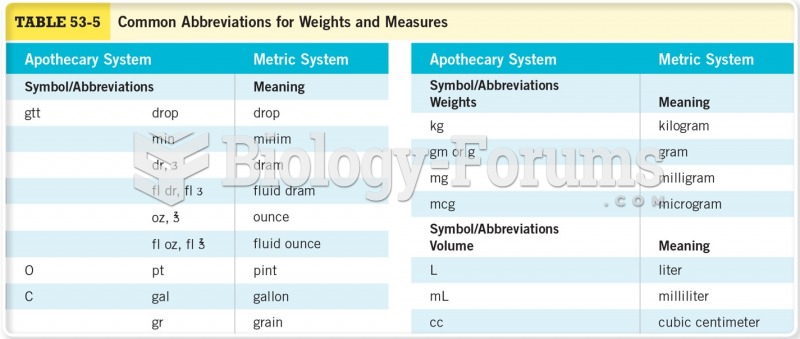 Commons Abbreviations for Weights and Measures
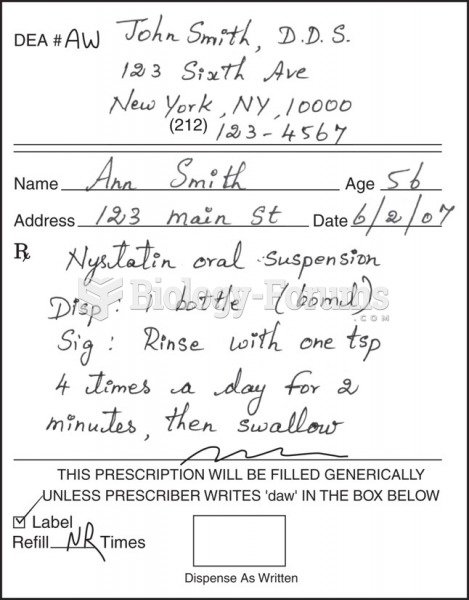 Sample prescriptions of drugs for oral fungal infections.
 Sample of a business card design.