This topic contains a solution. Click here to go to the answer
|
|
|

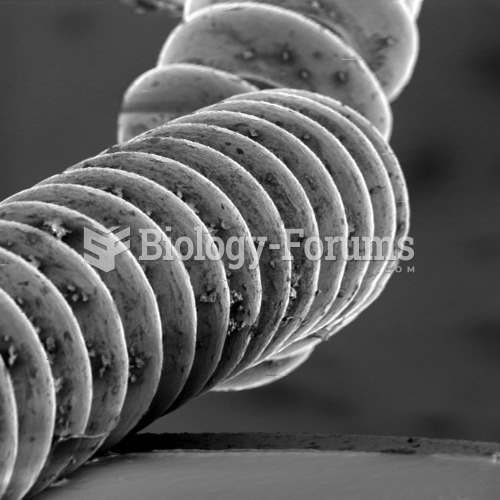 Guitar String
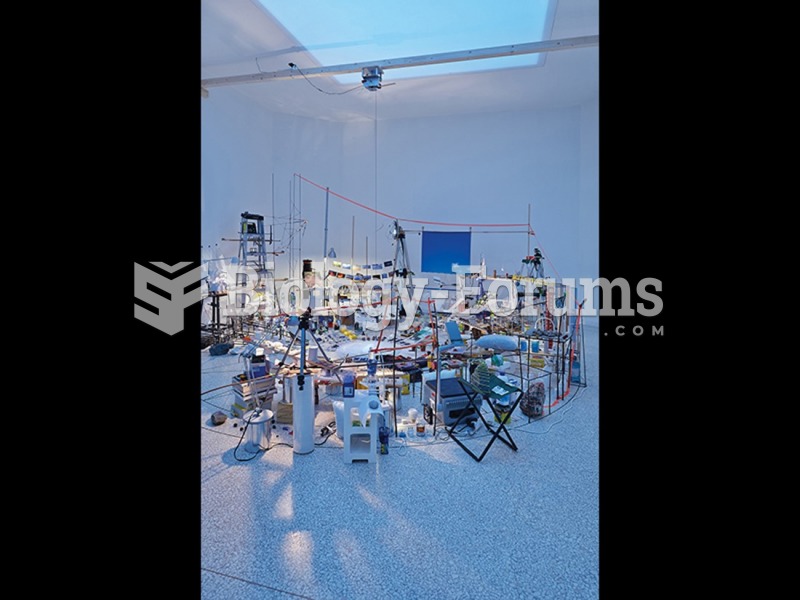 Sarah Sze, Triple Point (Pendulum).
 Nancy Rubins, Pleasure Point.
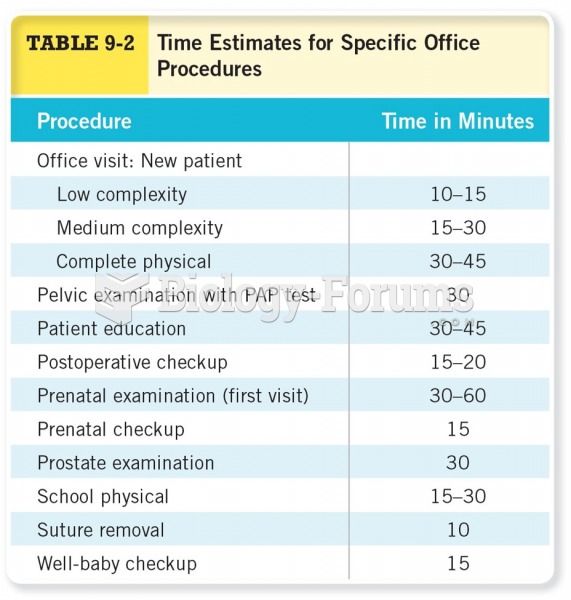 Time Estimates for Specific Office Procedures Cont.
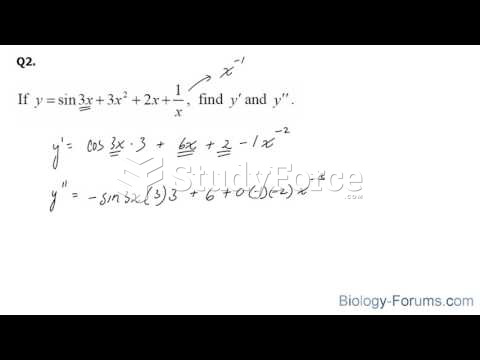 How to find the second derivative of a function
 Comparison of loss- and gain-of-function alleles