|
|
|
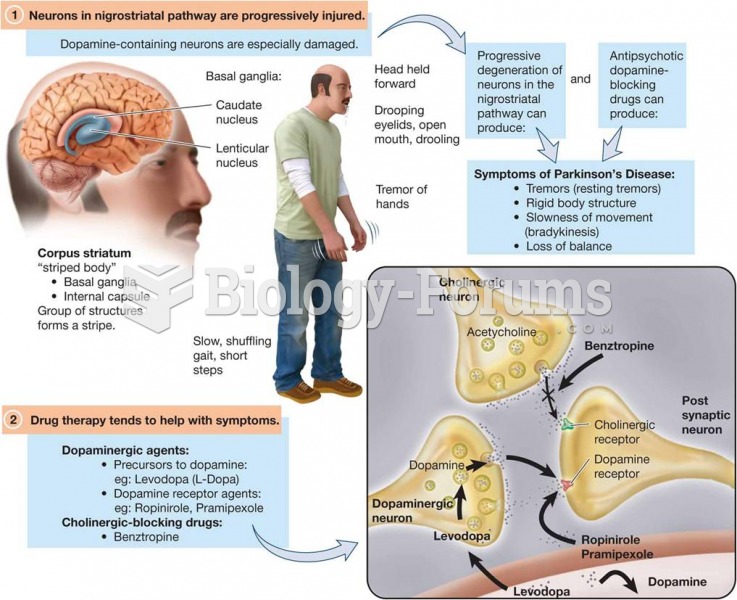
Disorders that may affect pharmacodynamics include genetic mutations, malnutrition, thyrotoxicosis, myasthenia gravis, Parkinson's disease, and certain forms of insulin-resistant diabetes mellitus.
The largest baby ever born weighed more than 23 pounds but died just 11 hours after his birth in 1879. The largest surviving baby was born in October 2009 in Sumatra, Indonesia, and weighed an astounding 19.2 pounds at birth.
The familiar sounds of your heart are made by the heart's valves as they open and close.
Certain topical medications such as clotrimazole and betamethasone are not approved for use in children younger than 12 years of age. They must be used very cautiously, as directed by a doctor, to treat any child. Children have a much greater response to topical steroid medications.
Historic treatments for rheumatoid arthritis have included gold salts, acupuncture, a diet consisting of apples or rhubarb, nutmeg, nettles, bee venom, bracelets made of copper, prayer, rest, tooth extractions, fasting, honey, vitamins, insulin, snow collected on Christmas, magnets, and electric convulsion therapy.


