This topic contains a solution. Click here to go to the answer
|
|
|

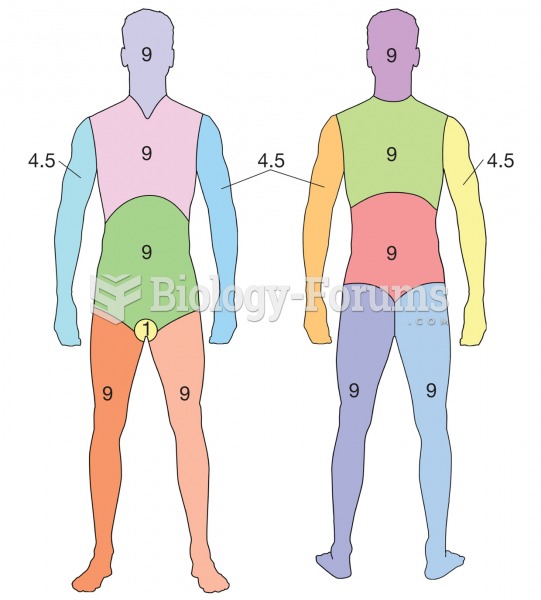 Rule of Nines. A method for determining percentage of body burned. Each different colored section re
 The Gender Pay Gap Over Time: What Percentage of Men's Income Do Women Earn?
 Set the meter to read ohms (V) and measure the resistance of the relay coil. The usual reading for ...
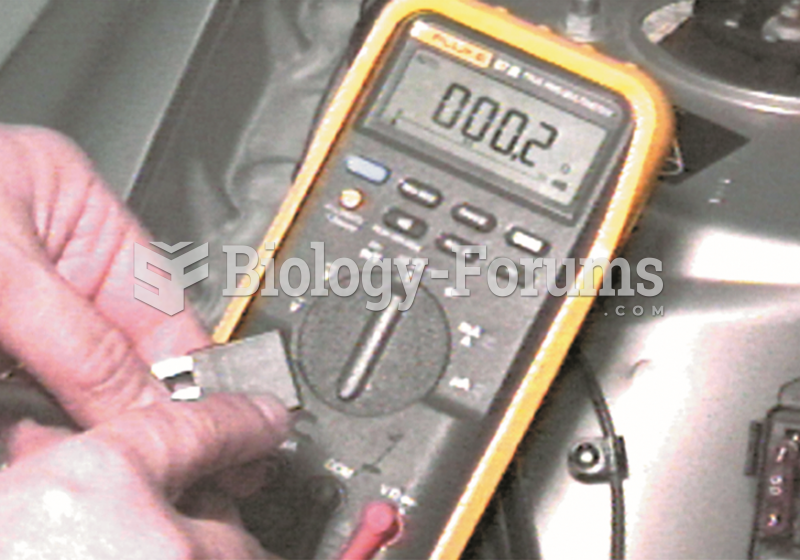 Measure between terminal 30 and 87a. Terminal 87a is the normally closed contact, and there should ...
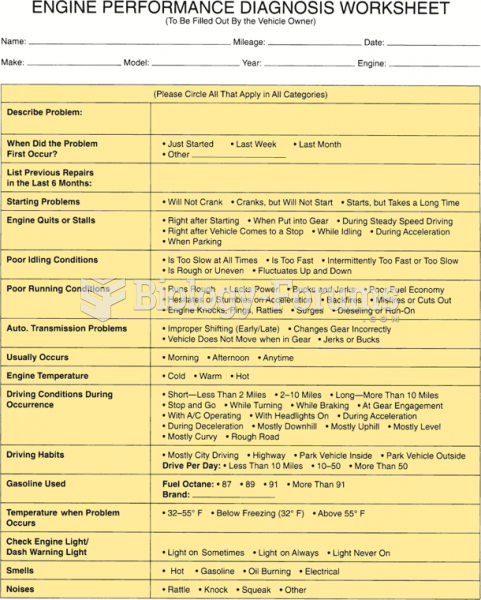 A form that the customer should fill out if there is a driveablilty concern to help the service ...
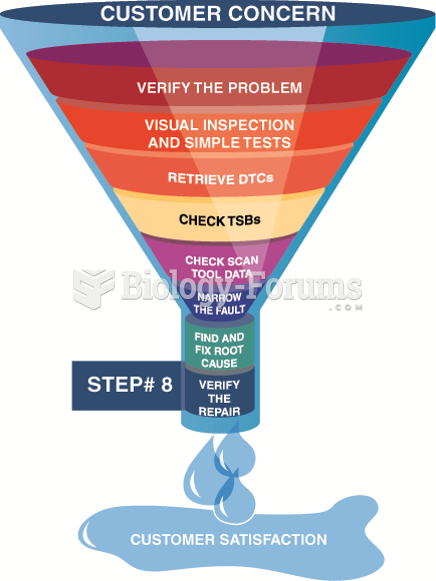 Step 8 is very important. Be sure that the customer’s concern has been corrected.