This topic contains a solution. Click here to go to the answer
|
|
|

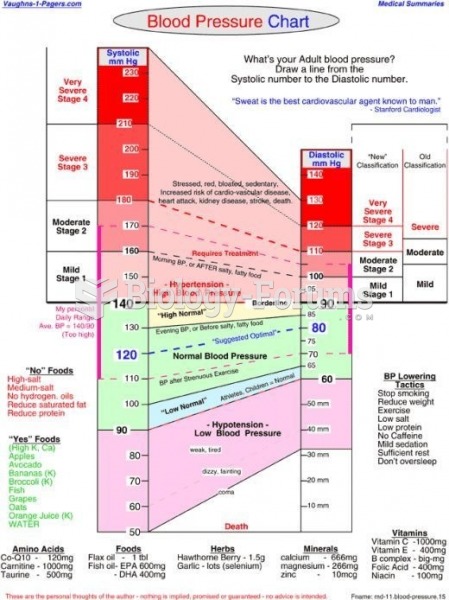 Blood Pressure Chart
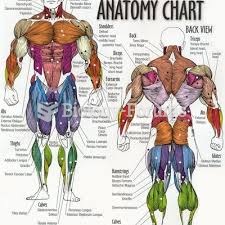 Anatomy Chart
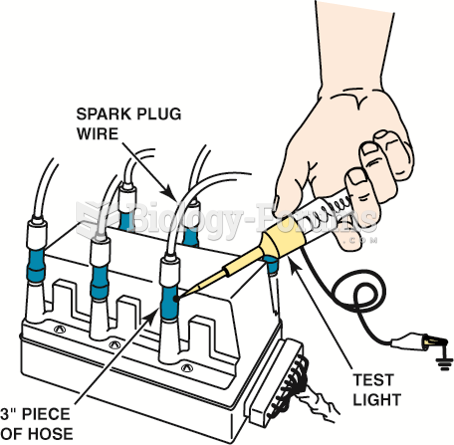 Using a vacuum hose and a test light to ground one cylinder at a time on a distributorless ignition ...
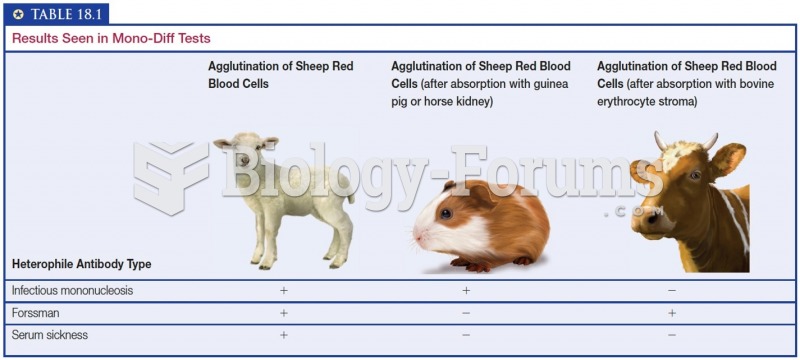 Results Seen in Mono-Diff Tests
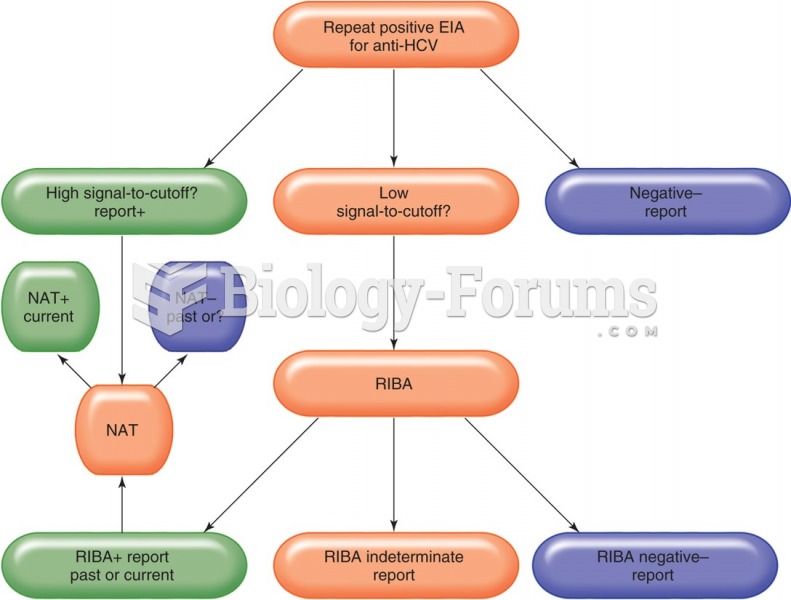 Flow chart for the diagnosis of hepatitis C. Hepatitis C reporting using the signal-tocutoff ratio.
 The Turing Test