|
|
|

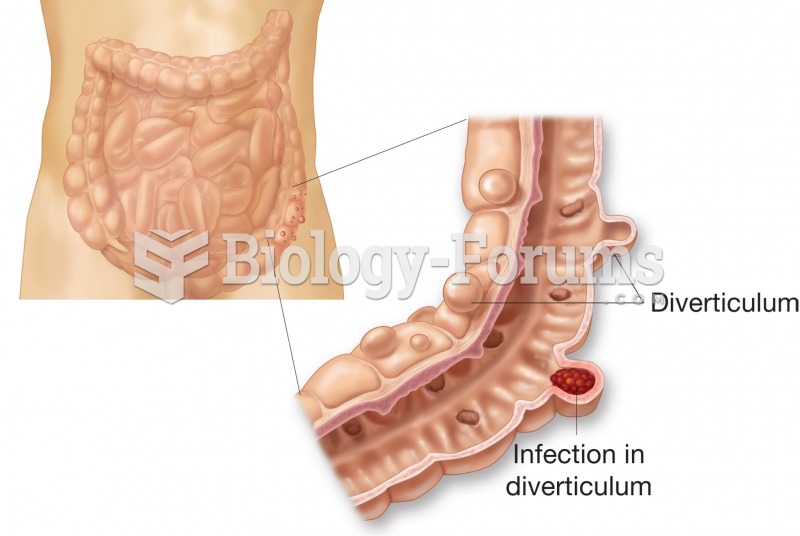 Diverticulosis. Figure illustrates external and internal appearance of diverticula.
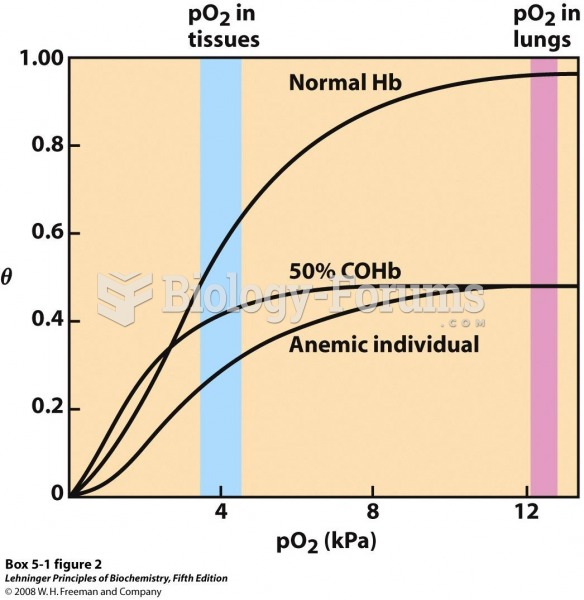 2 Several oxygen-binding curves: for normal hemoglobin
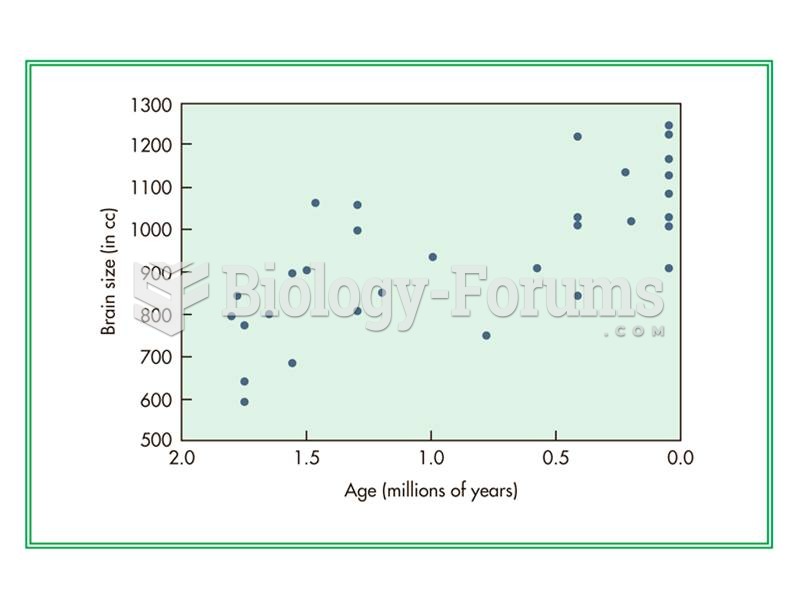 Although average brain size increases gradually though time in H. erectus, individuals with small br
 Many ideologies stem from older theories. The ideas of the philosophers are simplified. Ideologies
 What mass, in grams, of a 5.00% by mass sugar water solution is needed to supply
 An archaeological sample contains 0.700 g of lead-206 and 2.144 g of uranium-238. Assume that ...