|
|
|

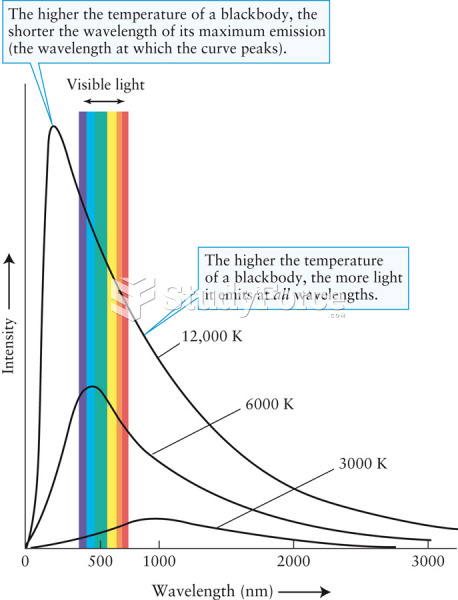 Blackbody Curves
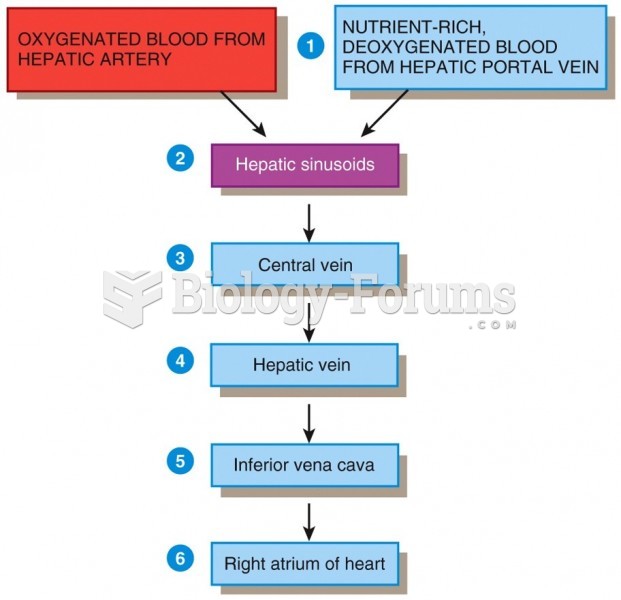 Blood Supply of the Liver
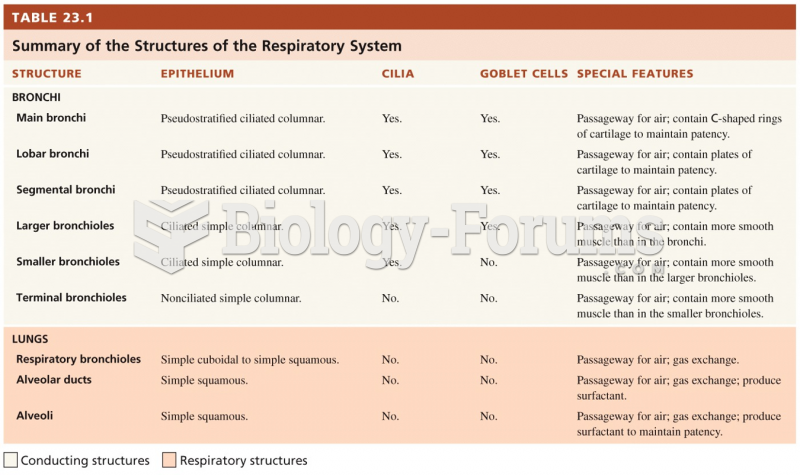 Blood Supply to the Lungs
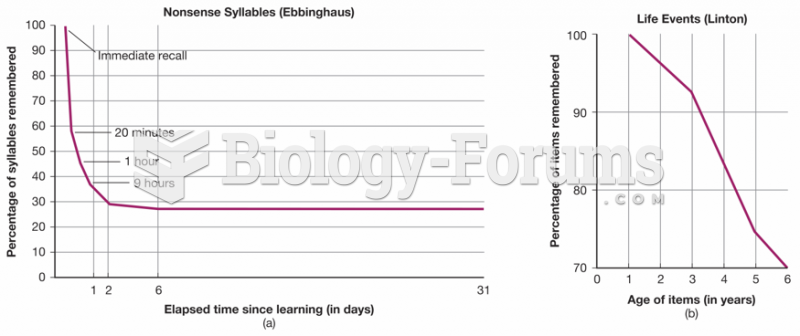 Two Kinds of Forgetting Curves
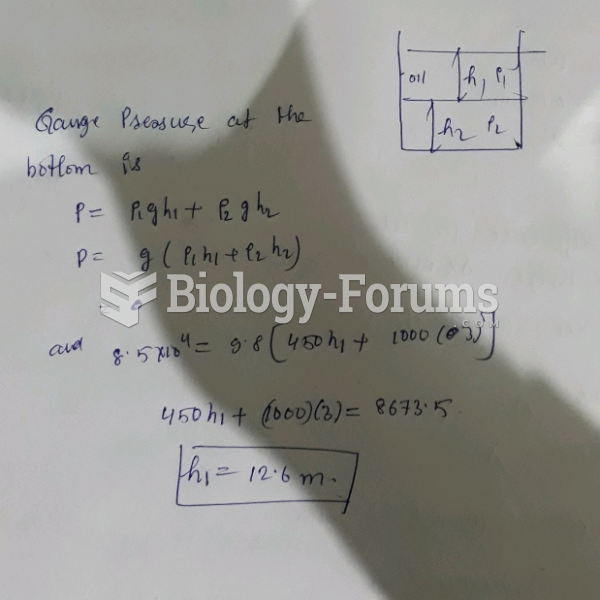 As shown in the figure, a large open tank contains a layer of oil ( density 450 kg/m3) floating ...
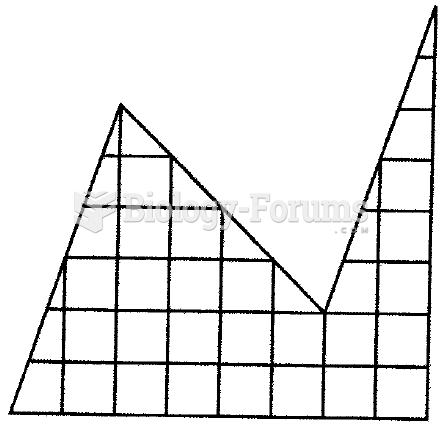 Cut the figure into two identical parts