|
|
|

 This image shows growing blood vessels in the retina of a mouse
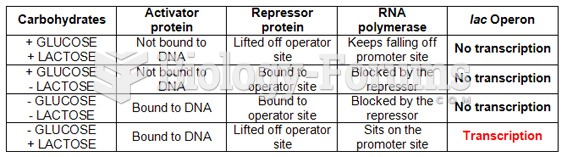 Lactose Operon Summary Chart
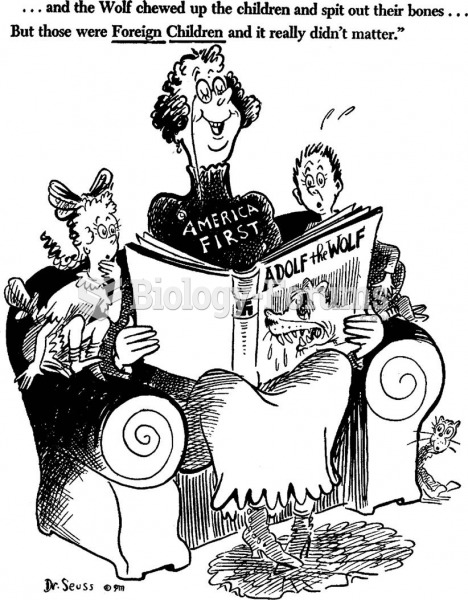 For a time Dr. Seuss—Theodor Seuss Geisel—drew political cartoons. This one, published in ...
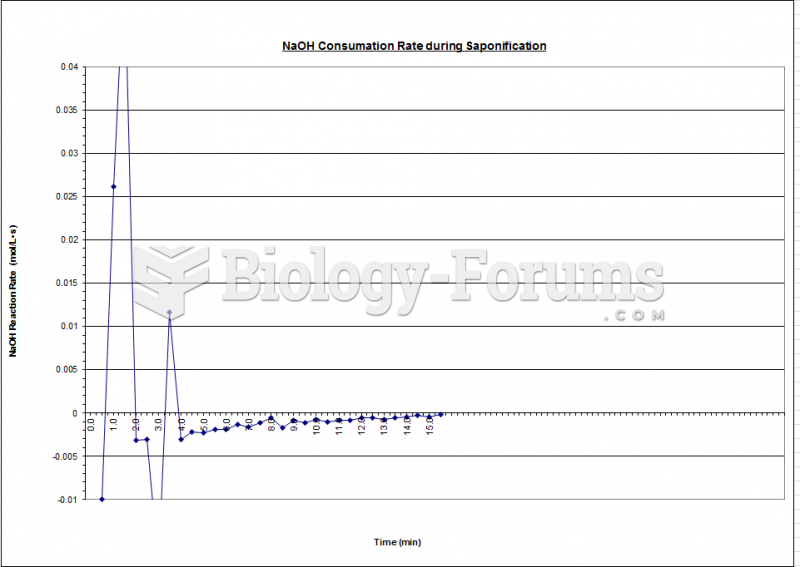 Fluidization - Reaction Rate Chart
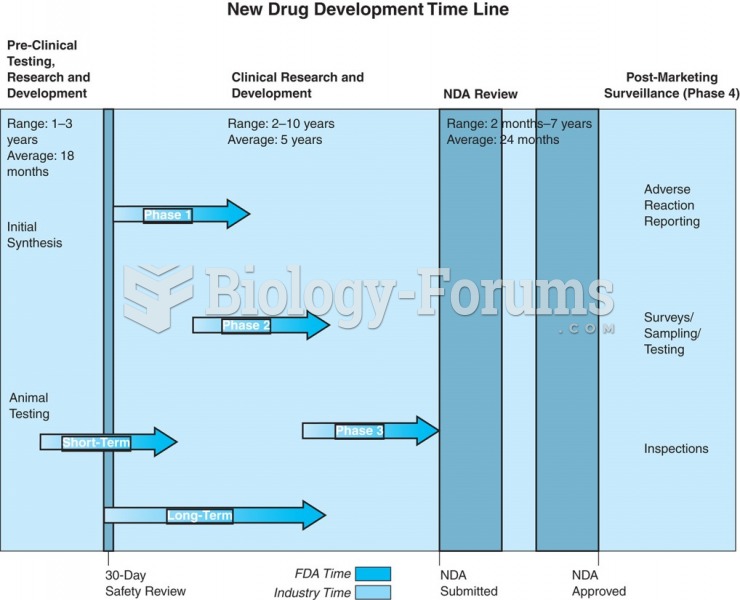 A new drug development time line with the four phases of drug approval.
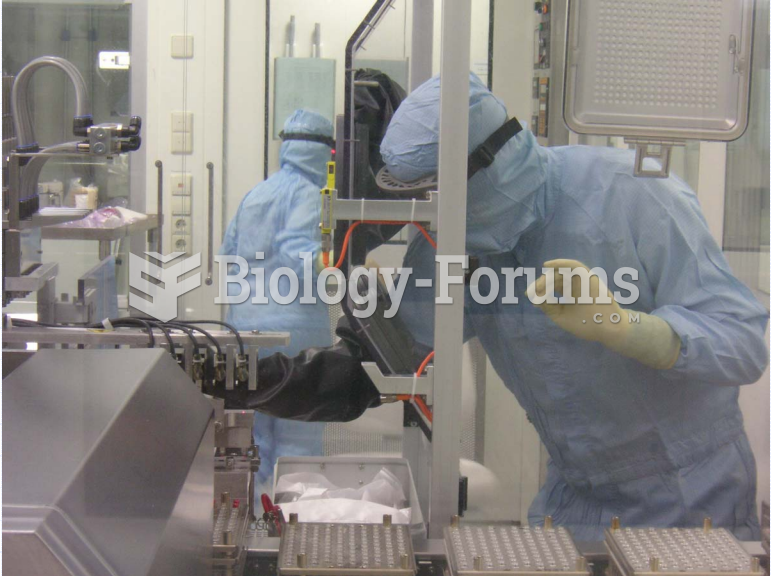 Risk & Aseptic Processing - RABs Filling Line