|
|
|

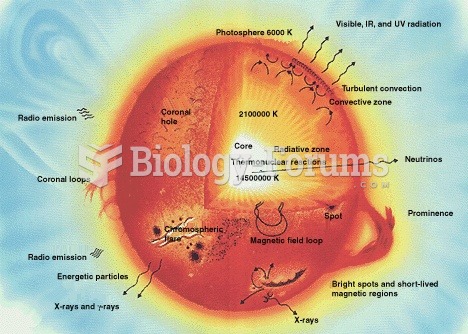 This diagram shows a cross-section of a solar-type star.
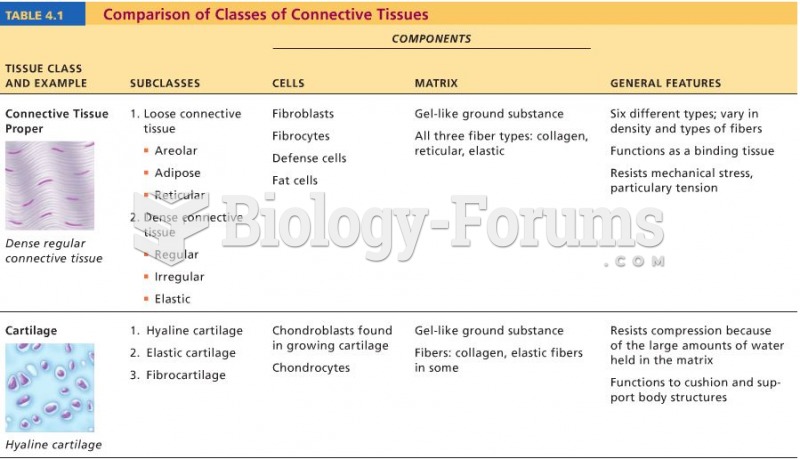 Tissue Chart
 Increased neurogenesis in the dentate gyrus following damage. The left panel shows (1) an ...
 Chart
Chart
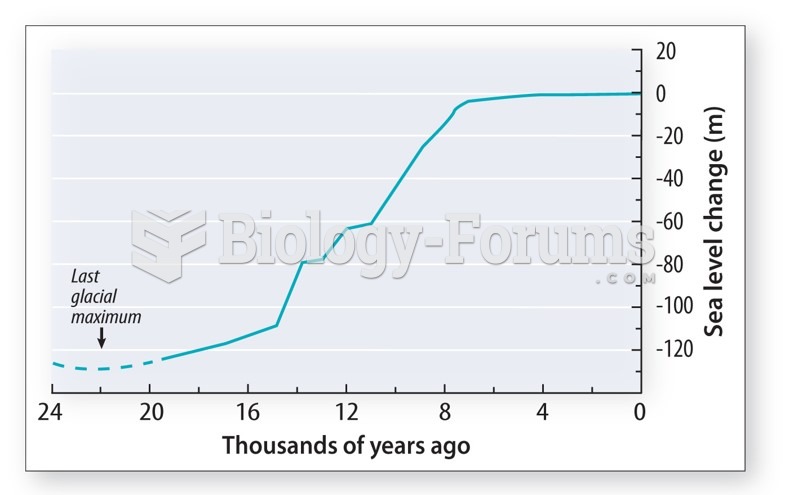 End of last glacial period
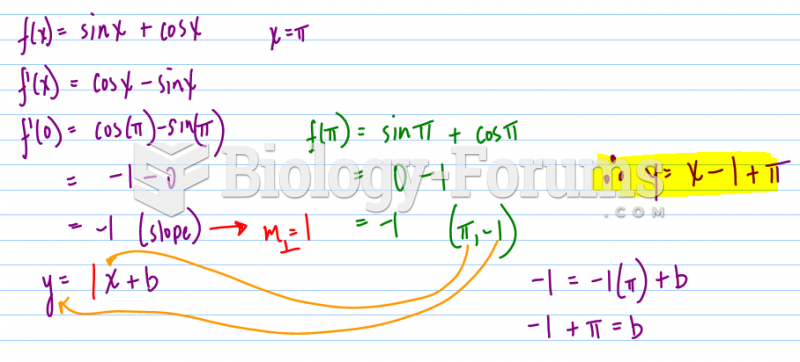 Find the equation of the normal line to f(x)=sinx+cosx at x = π.