|
|
|

 History of the number of observed sunspots during the last 250 years, which shows the ~11-year solar
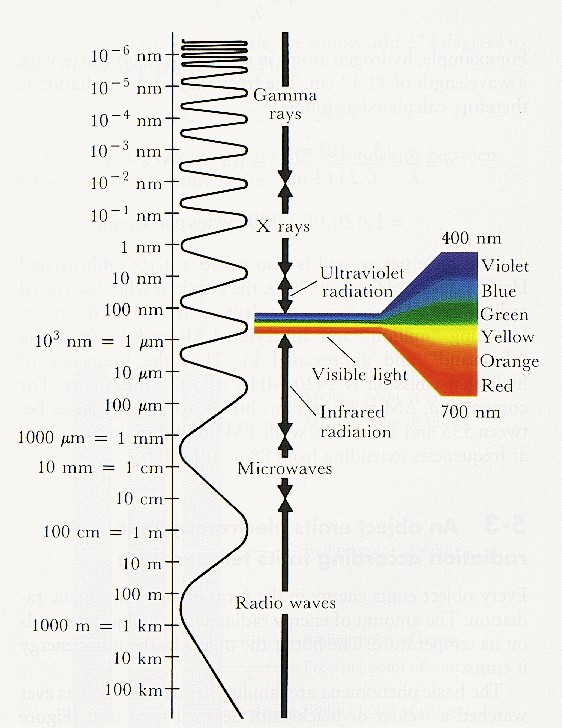 Electromagnetic Radiation Chart
 Critical Thinking Skills chart
 The photo shows an ultrasound image of a fetus. The rough outline of a head and body can be seen. ...
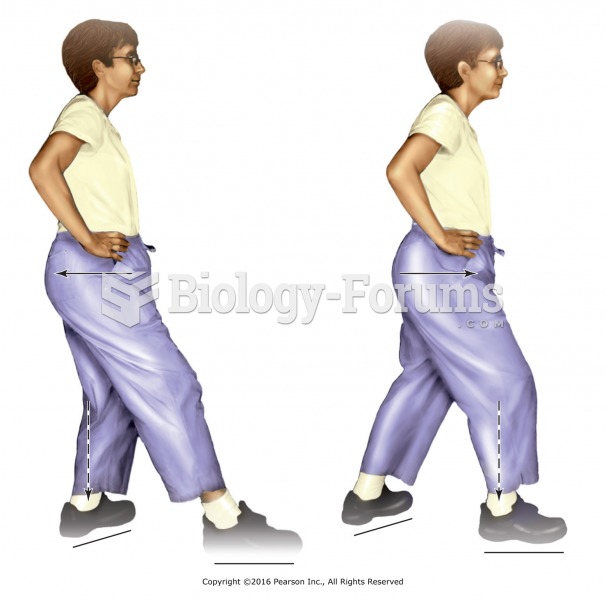 Tai chi stance with front foot pointing straight ahead and back foot at 45° angle, heels in line, ...
 Beau’s line