|
|
|

 Comparing the jaws of chimpanzees, australopithecines, and humans.
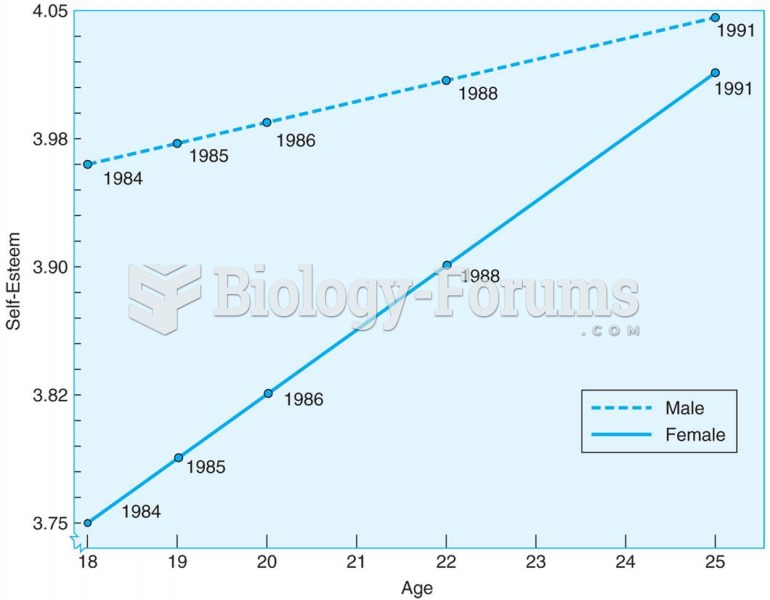 Young adults increase in self-esteem between the ages of 18 and 25, according to this longitudinal s
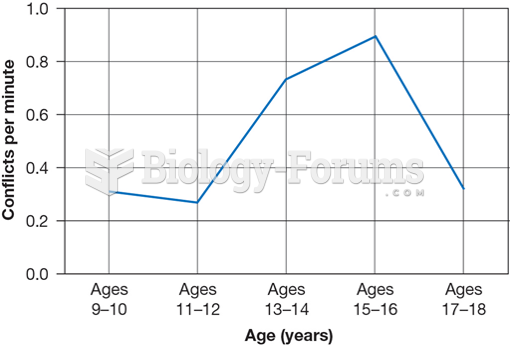 Observed Mother–Child Arguments at Five Time Points Over an Eight-Year Period
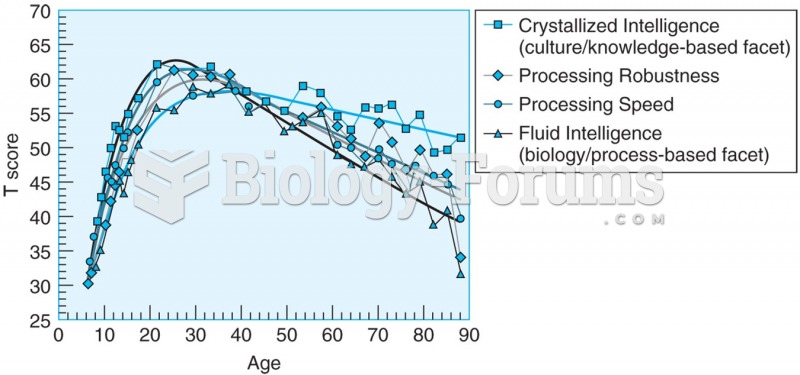 Age-related changes in crystallized and fluid tasks. Performance on tests of fluid abilities peaked ...
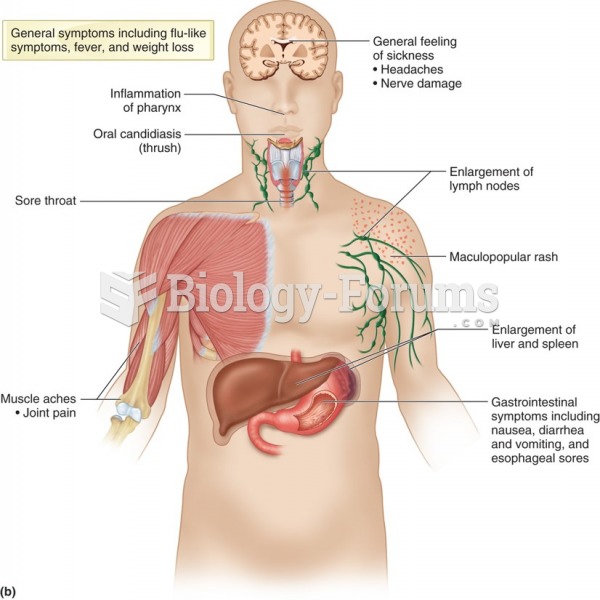 Time course of HIV infection.
 Sturtevant’s Recombination Data for Five X-Linked Genes in Drosophila