This topic contains a solution. Click here to go to the answer
|
|
|

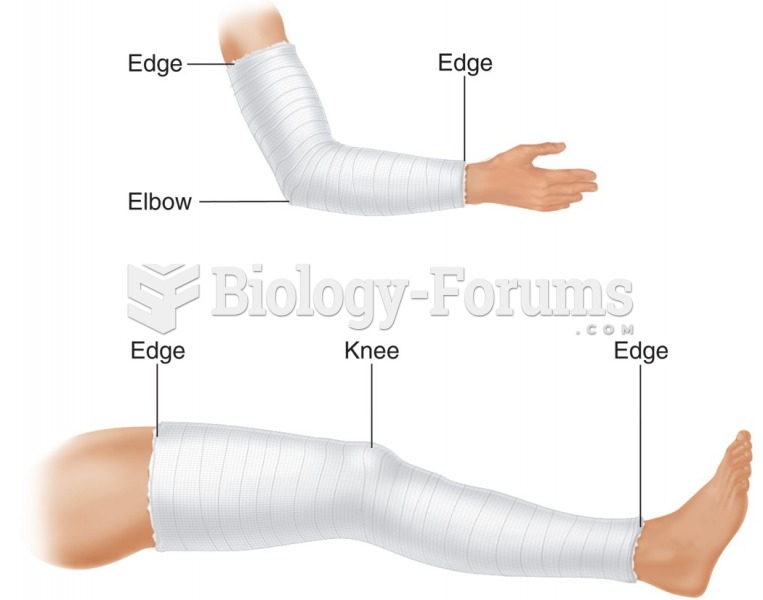 Check the edges of a cast and report any changes.
 Using a black light to spot leaks after adding dye to the oil.
 Research Report Evaluation Worksheet
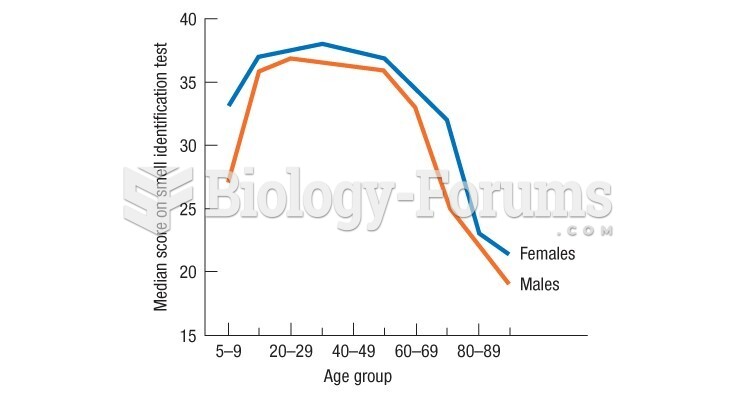 Doty's data show a very rapid drop in late adulthood in the ability to identify smells
 Trapezoidal Rule Graph
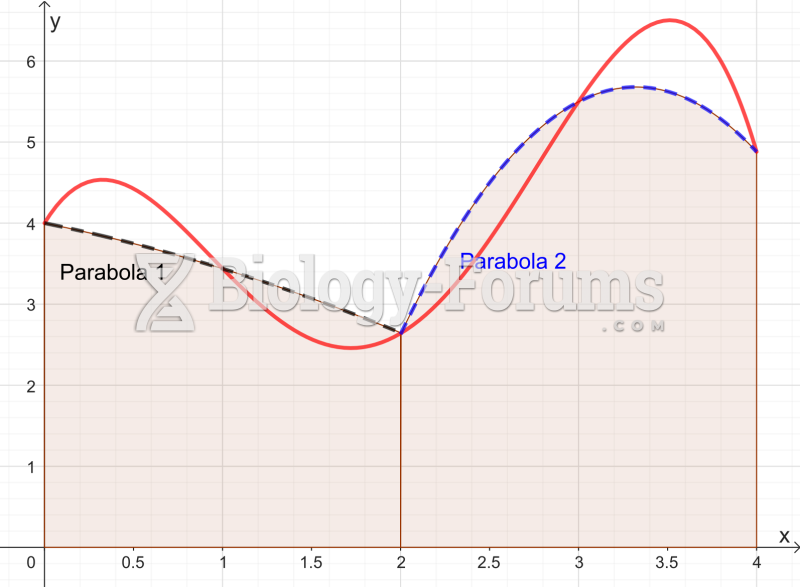 Graph approximated by two parabolas for the Simpson's rule