This topic contains a solution. Click here to go to the answer
|
|
|

 A, A nurse is adding a medication to an IV line as a piggyback
 Check the edges of a cast and report any changes.
 Adding additional amounts of ethyl alcohol (ethanol) increases the frequency reading.
 Tag identify that the power has been removed and service work is being done.
 How to find the possible equations of a graph?
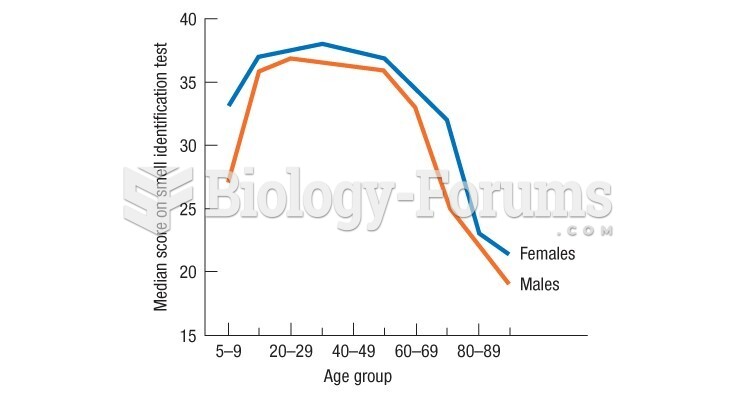 Doty's data show a very rapid drop in late adulthood in the ability to identify smells