This topic contains a solution. Click here to go to the answer
|
|
|

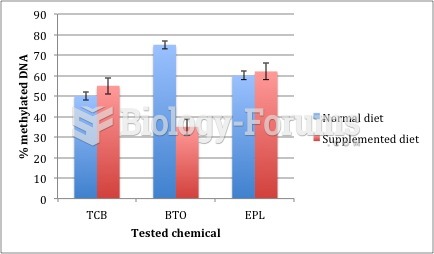 Graph of 3 compounds tested
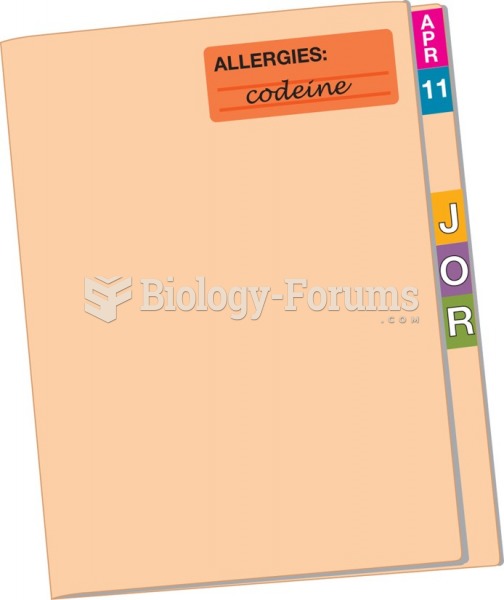 Using alert labels enables the medical staff to quickly identify important information such as ...
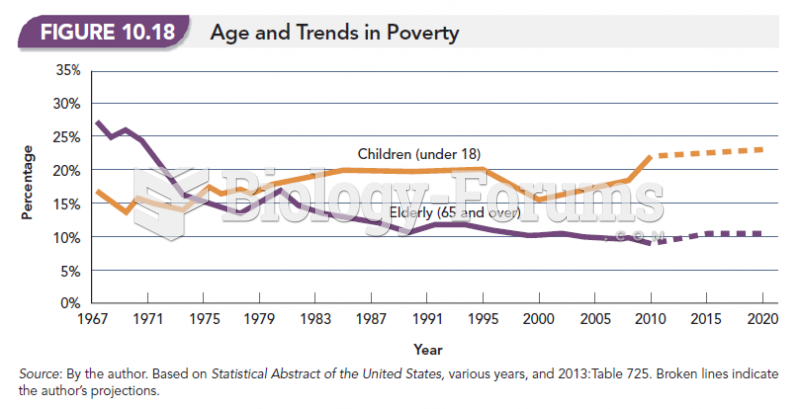 Age and Trends in Poverty
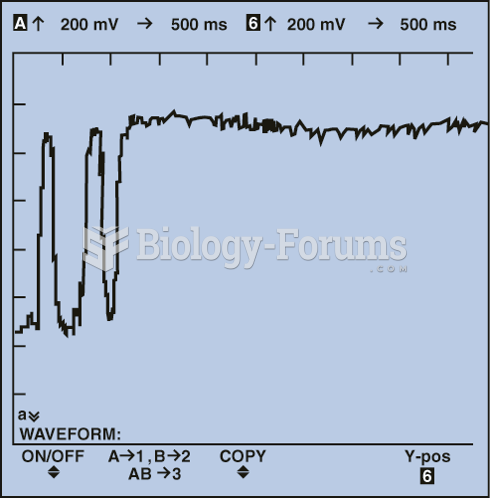 Adding propane to the air inlet of an engine operating in closed loop with a working oxygen sensor ...
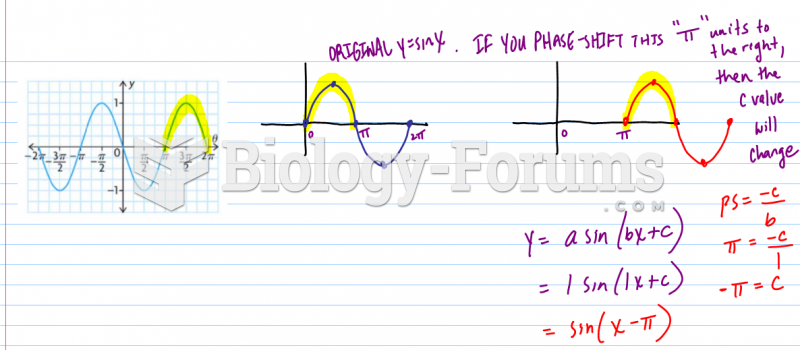 How to find the possible equations of a graph?
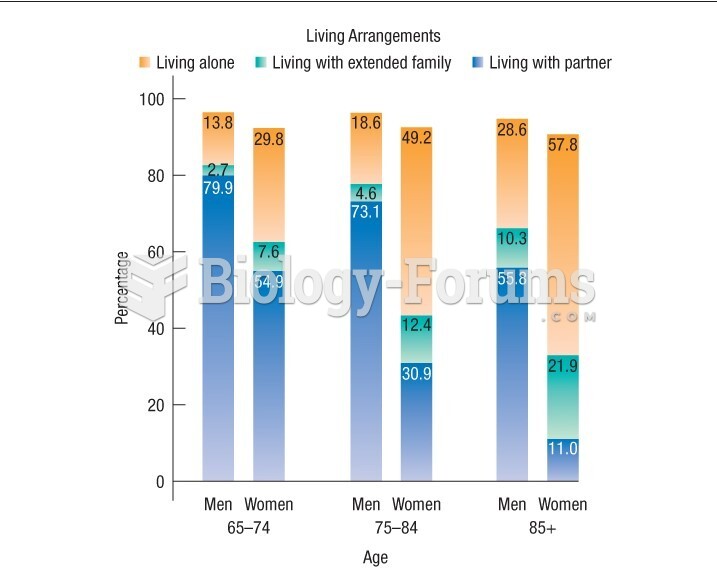 Graph shows the living arrangements of Canadian seniors