This topic contains a solution. Click here to go to the answer
|
|
|

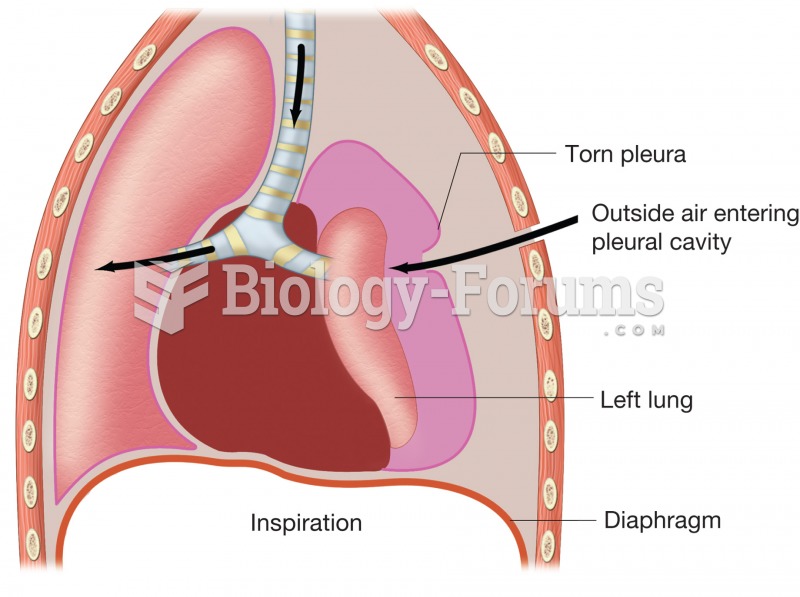 Pneumothorax. Figure illustrates how puncture of thoracic wall and tearing of pleural membrane allow
 A medical assistant should present a neat appearance and make it a habit to wear a smile.
 A food diary can help patients identify unhealthy eating habits and make healthy choices.
 Does everything in nature have a unique purpose (entelechy)?
 Peer group activity of adolescents
 Jane was due to make loan payments of S1872 nine months ago, S3074 five month ago, and S498 in ...