This topic contains a solution. Click here to go to the answer
|
|
|

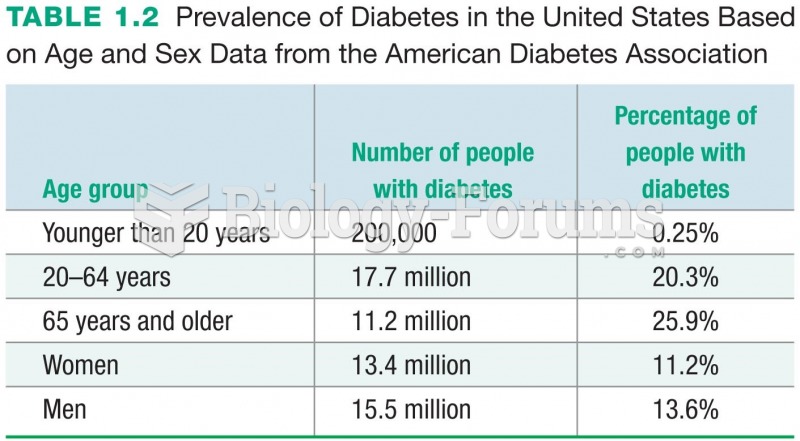 Prevalence of Diabetes in the United States Based on Age and Sex Data from the American Diabetes ...
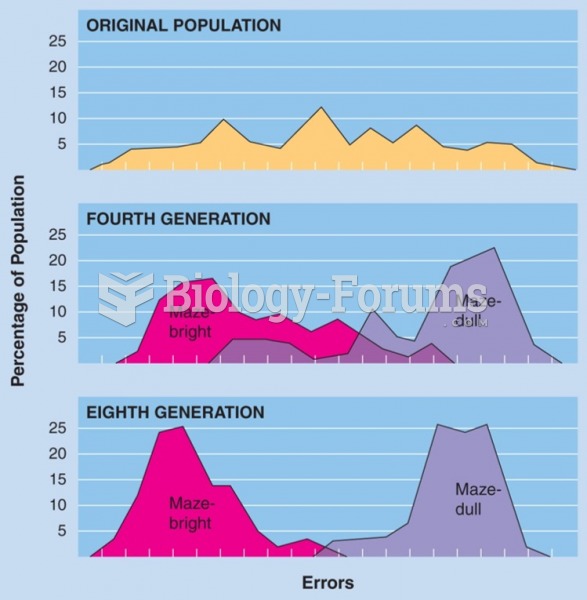 Selective breeding of maze-bright and maze-dull strains of rats by Tryon (1934). (Data from Cooper, ...
 A mobile weather station that can be used to gather current weather data at the scene of hazardous ...
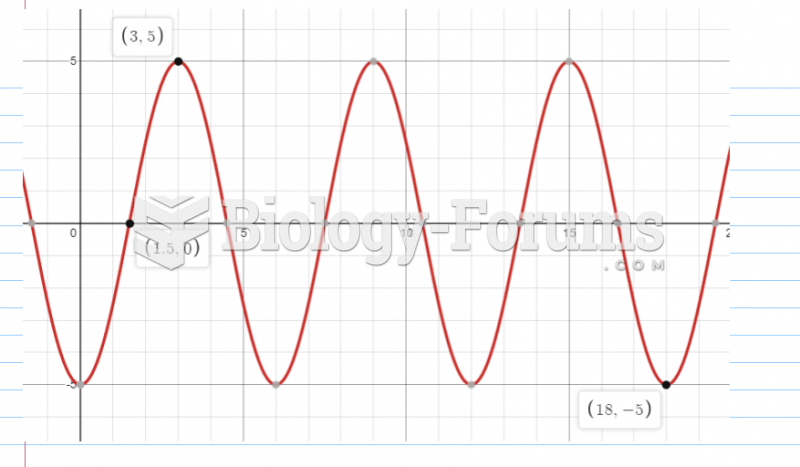 Sketch a graph of the function h(x), by hand on the following interval:
 Analysts expect Virtucon to make payouts of $8.7643B at the end of this year. Assume that all ...
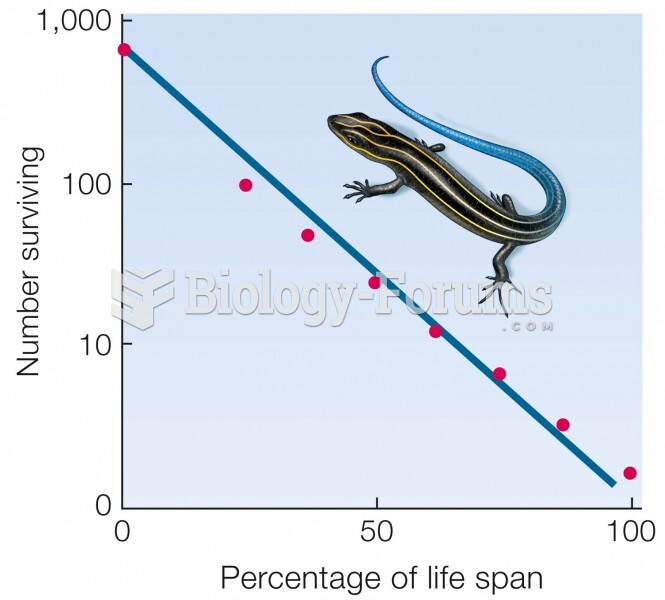 Type II curve. Mortality does not vary with age. Data for five-lined skink (Eumeces fasciatus).