|
|
|

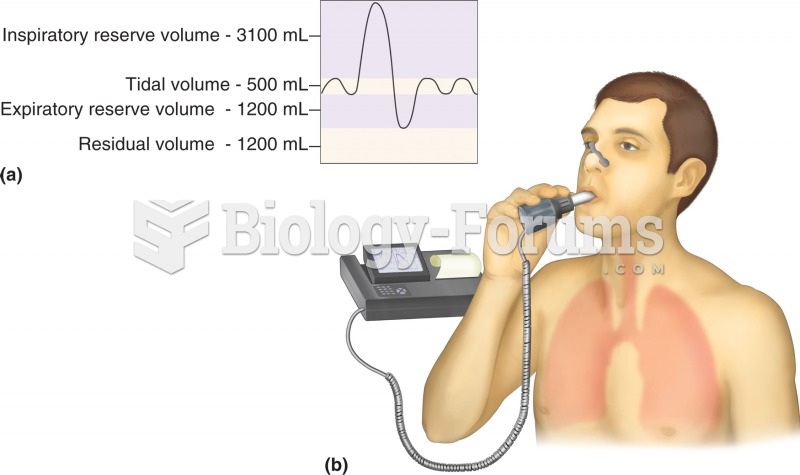 Pulmonary function test: spirometry. (a) Normal respiratory volumes, as measured during spirometry.
 This chart illustrates the “drip down” model of government. In this, politics is formed by the soc
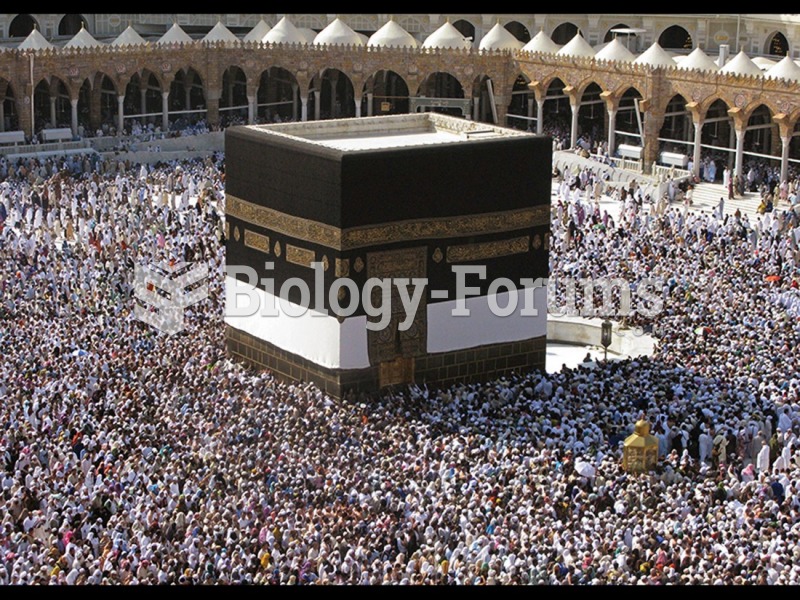 The Kaaba, center of the Haram Mosque, Mecca, Saudi Arabia.
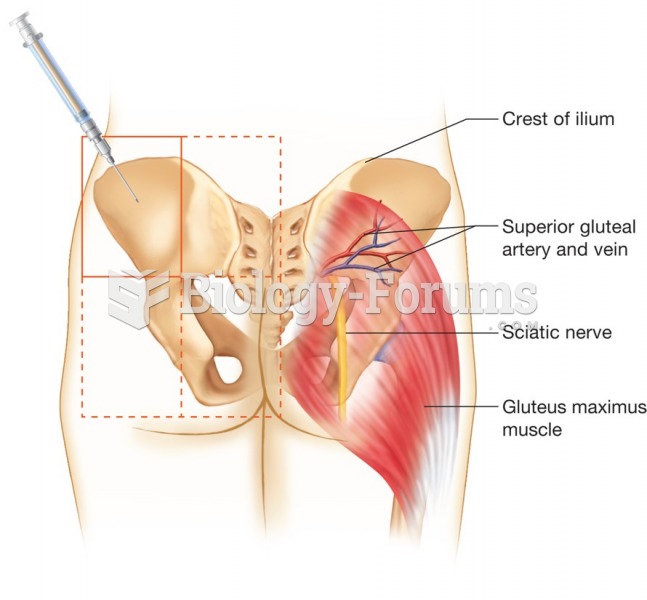 Injecting the upper outer quadrant of the buttocks.
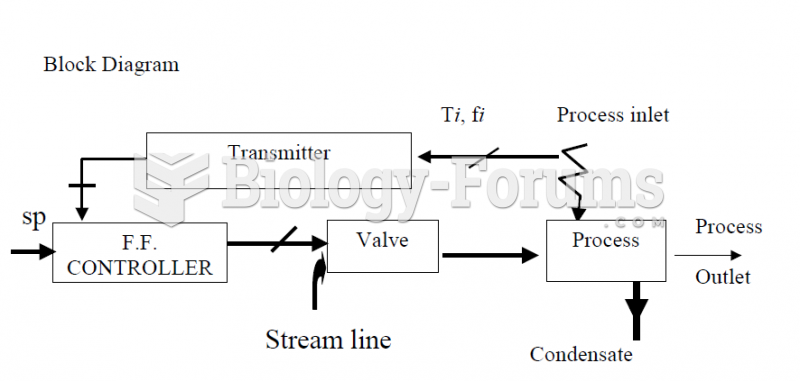 Heat Exchanger Block Diagram Feedforward Control
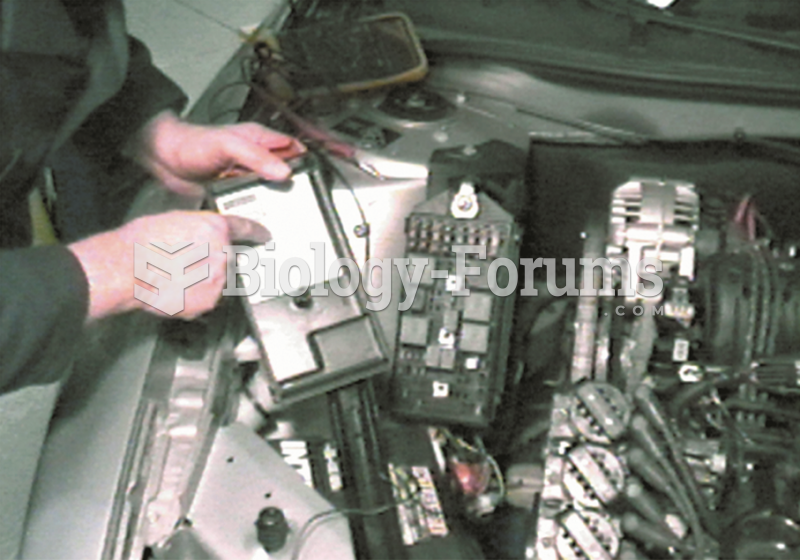 Start the diagnosis by locating the relay center. It is under the hood on this General Motors ...