|
|
|

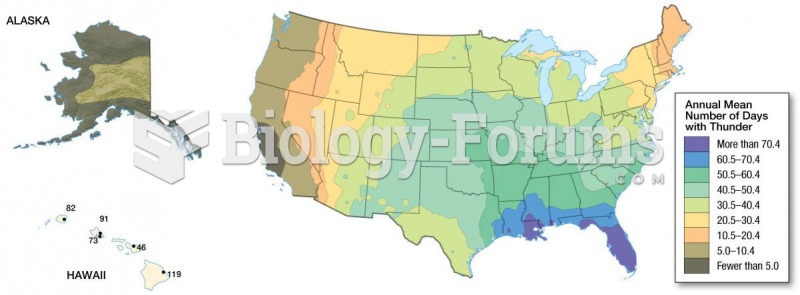 Distribution of Thunderstorms: Detailed data on cloud-to-ground lightning flashes have been ...
 How to calculate the mean for grouped data
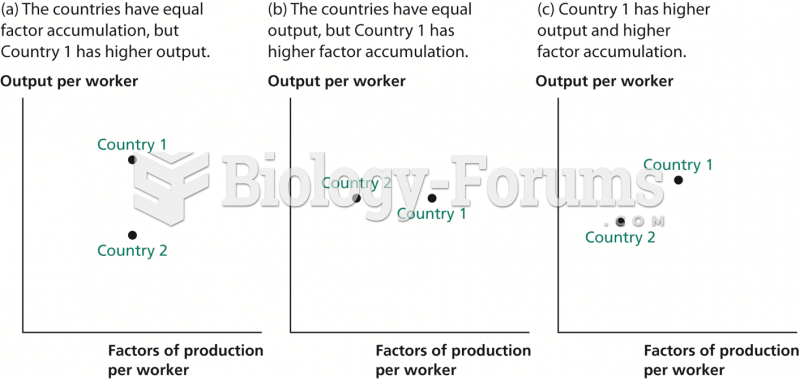 Inferring Productivity from Data on Output and Factor Accumulation
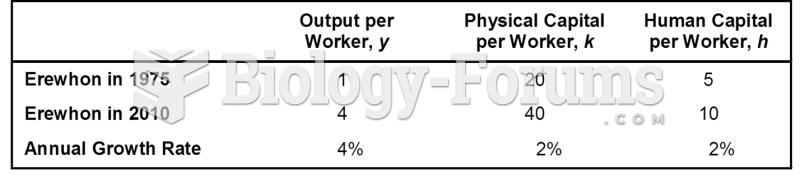 Data for Calculating Productivity Growth in Erewhon
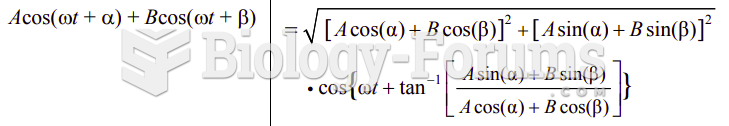 Adding different Angular frequency w(t)?
 The forked-line method for determining gamete genotype frequency