|
|
|

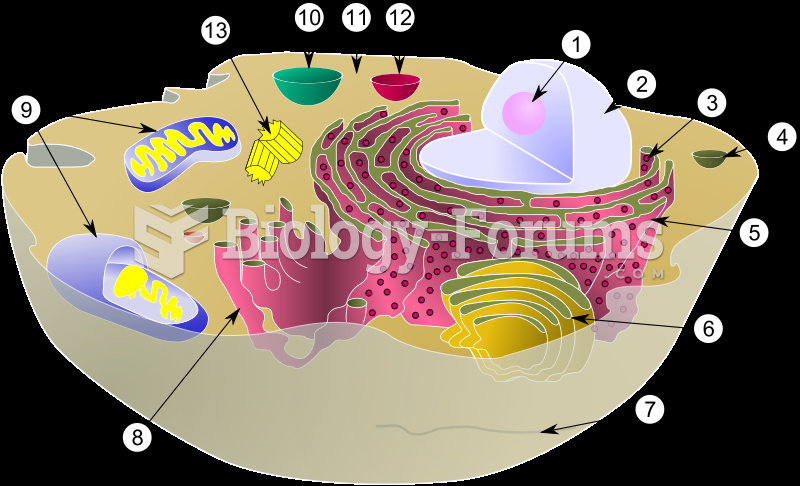 Schematic of typical animal cell depicting the various organelles and structures.
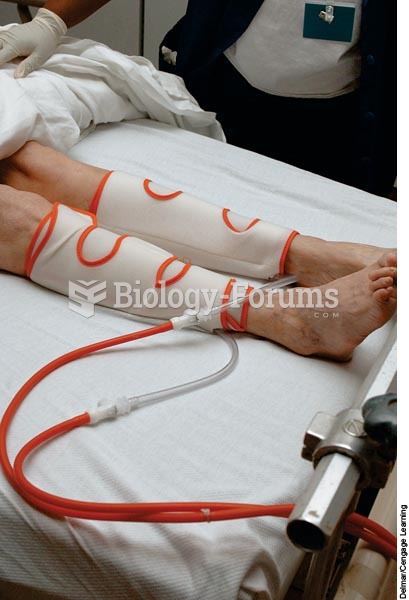 An alternating pneumatic compression device squeezes the leg tissues causing blood to move toward th
 Artificial Heart Device
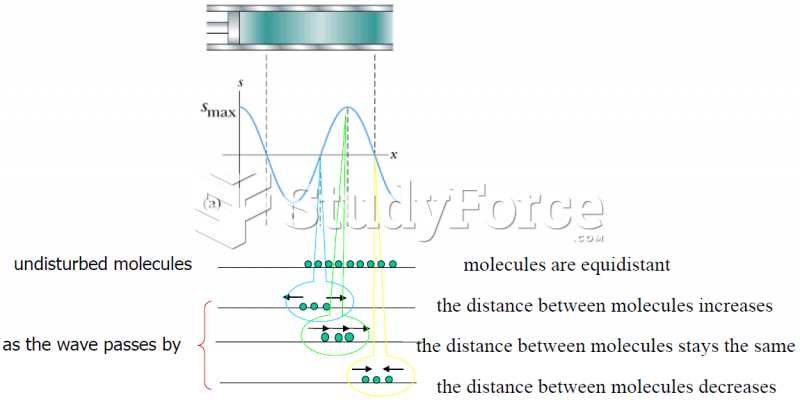 Graphical representation of a sinusoidal longitudinal wave
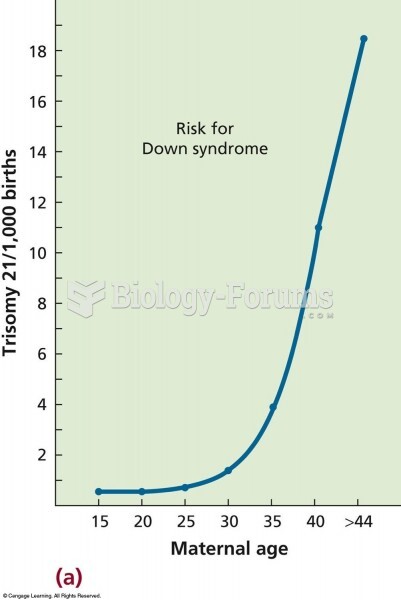 The relationship between maternal age and the frequency of trisomy 21 (Down syndrome). The risk incr
 The Hfr chromosome time-of-entry map is assembled from the recombinant data