|
|
|

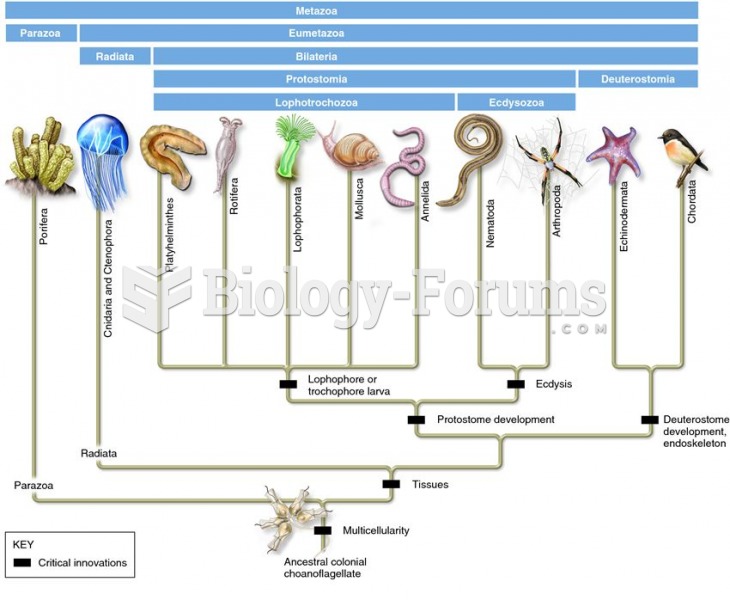 A revised animal phylogeny based on molecular data of SSU rRNA
 A health history is essential in collecting subjective data about metabolic acidosis.
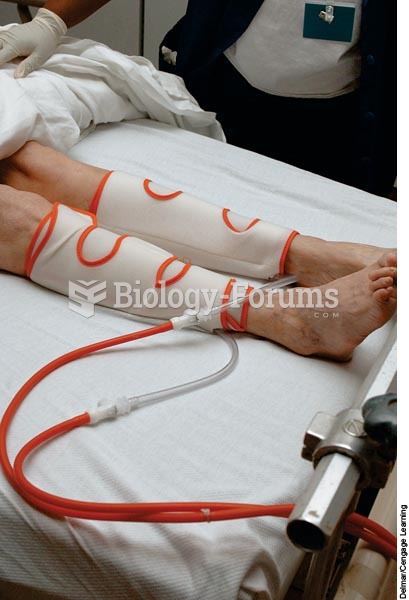 An alternating pneumatic compression device squeezes the leg tissues causing blood to move toward th
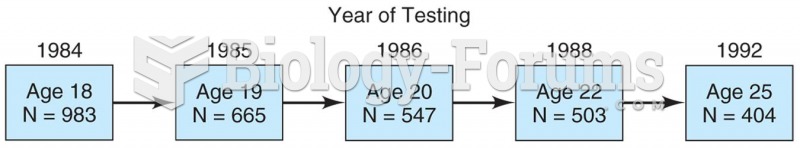 Model of a longitudinal study in which 983 students were surveyed in 1984 and then again in 1985, 19
 How to create a frequency table and histogram from raw data
 Solve the solution set of the following system using Graphical Method.