|
|
|

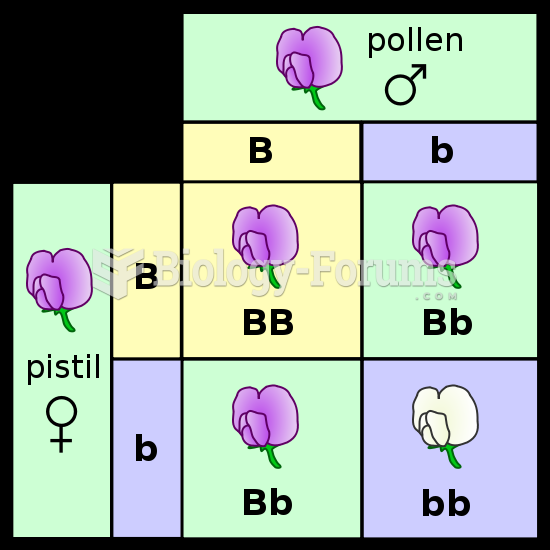 A Punnett square depicting a cross between two pea plants heterozygous for purple (B) and white (b)
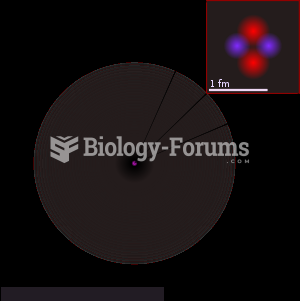 An illustration of the helium atom, depicting the nucleus (pink) and the electron cloud distribution
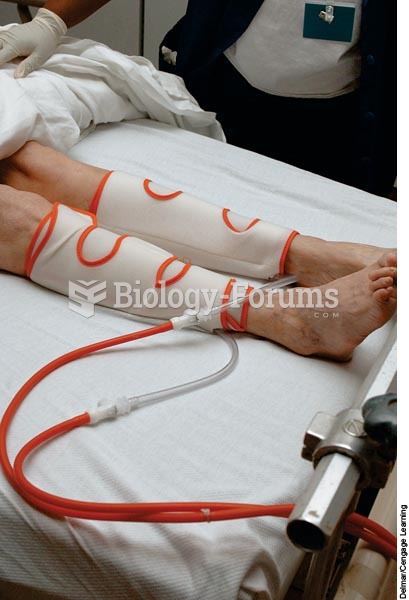 An alternating pneumatic compression device squeezes the leg tissues causing blood to move toward th
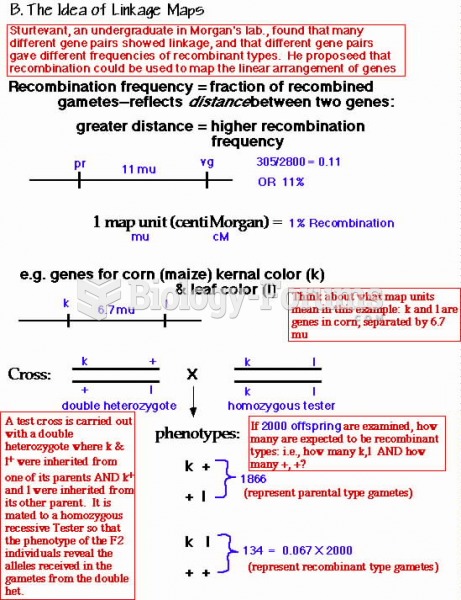 recombination frequency
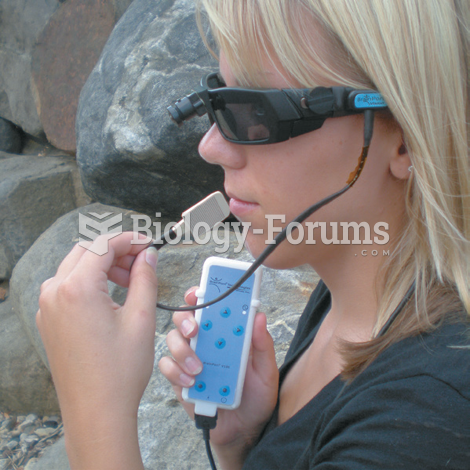 Sensory Crossover Device for Visually Impaired People
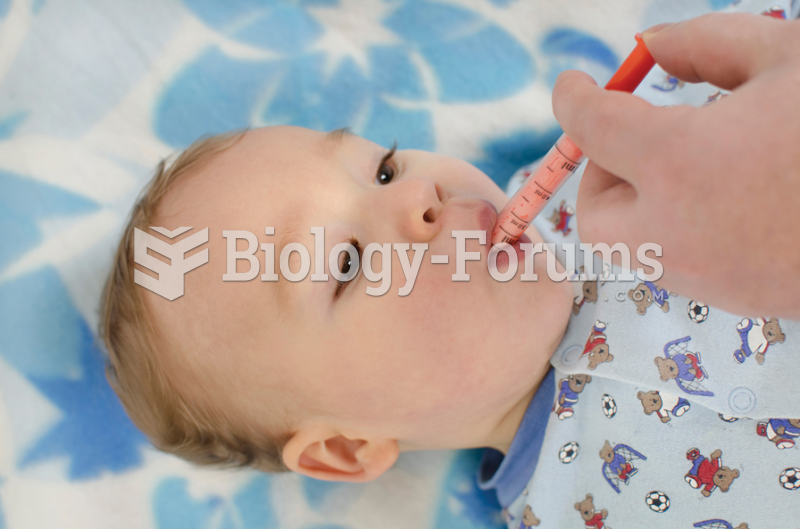 Using the measuring device to give the correct dose to children