This topic contains a solution. Click here to go to the answer
|
|
|

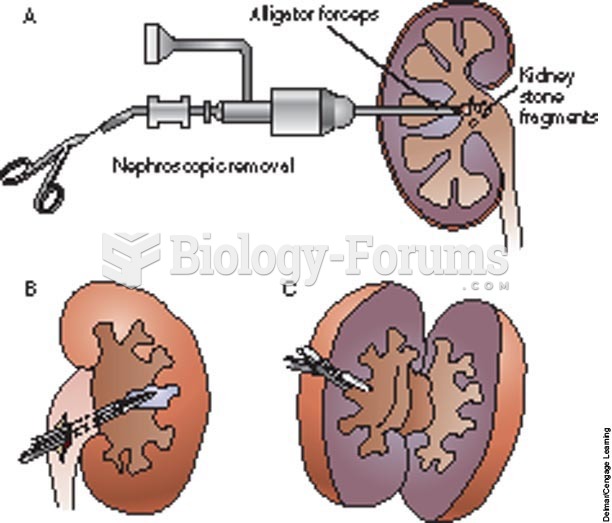 Methods of removing urinary stones
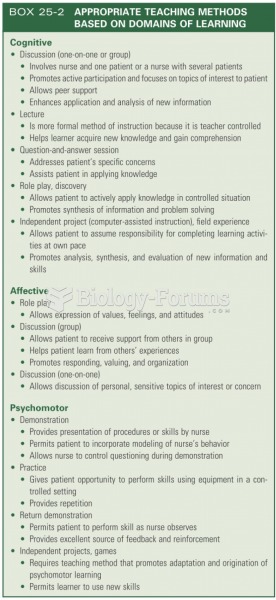 Appropriate teaching methods
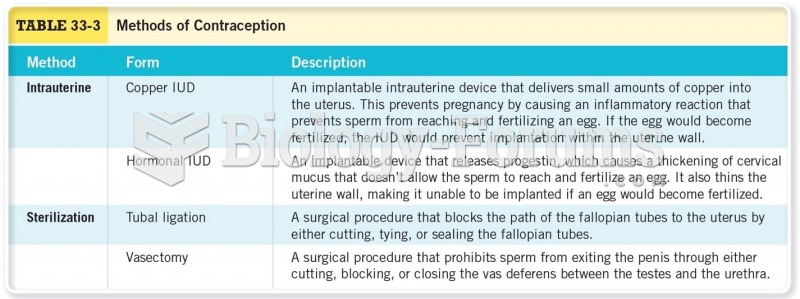 Methods of Contraception
 IPM combines biocontrol and chemical methods
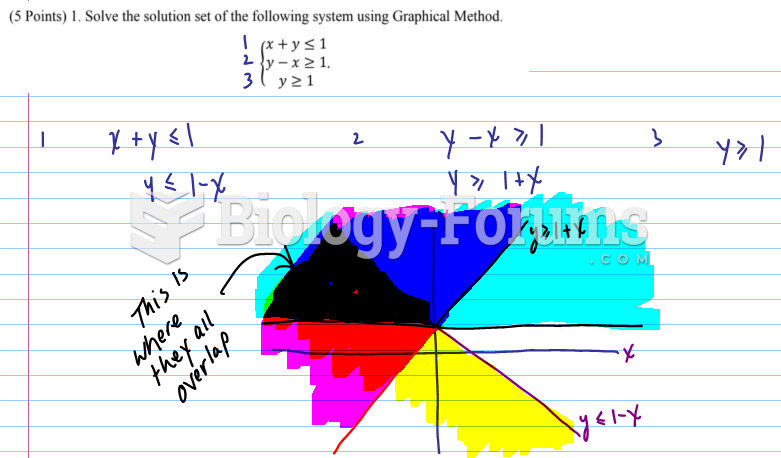 Solve the solution set of the following system using Graphical Method.
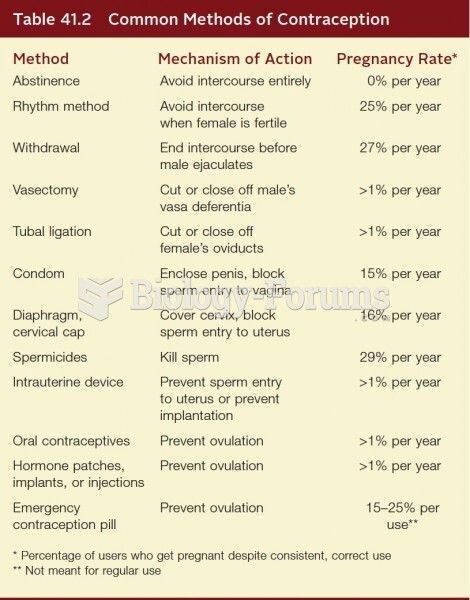 Common Methods of Contraception