This topic contains a solution. Click here to go to the answer
|
|
|

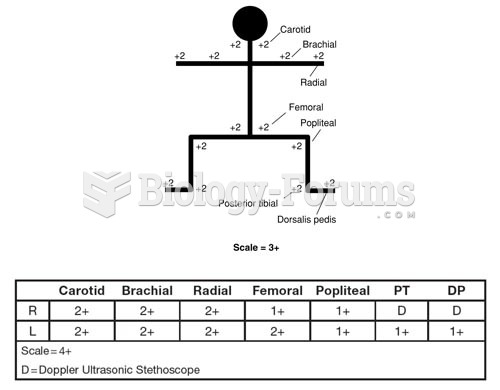 Methods to Document Peripheral Pulses A. Stick Figure Peripheral Pulse Documentation B. Tabular Peri
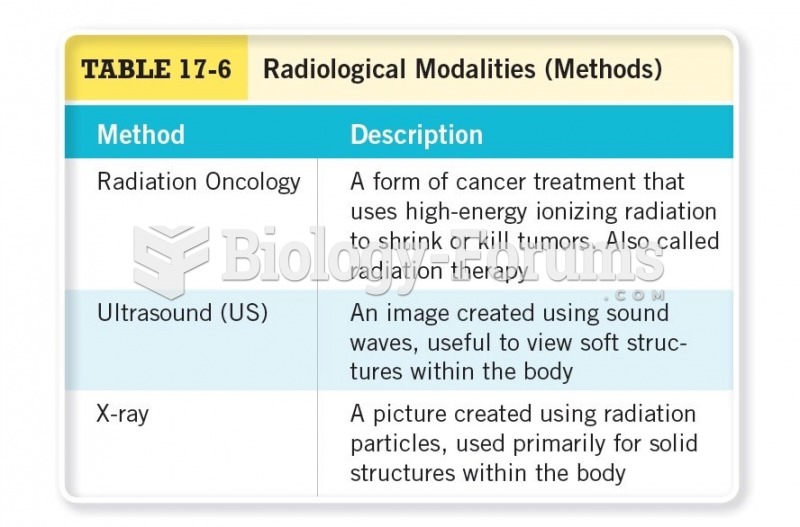 Radiological Modalities (Methods) Cont.
 Distribution of Thunderstorms: Detailed data on cloud-to-ground lightning flashes have been ...
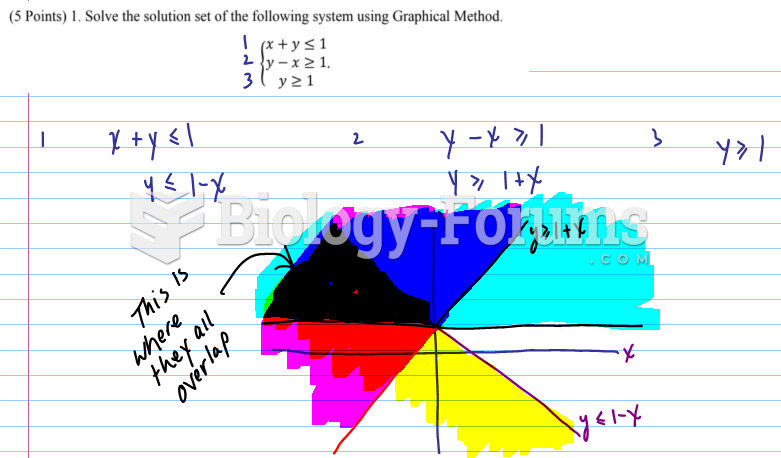 Solve the solution set of the following system using Graphical Method.
 Data management questions
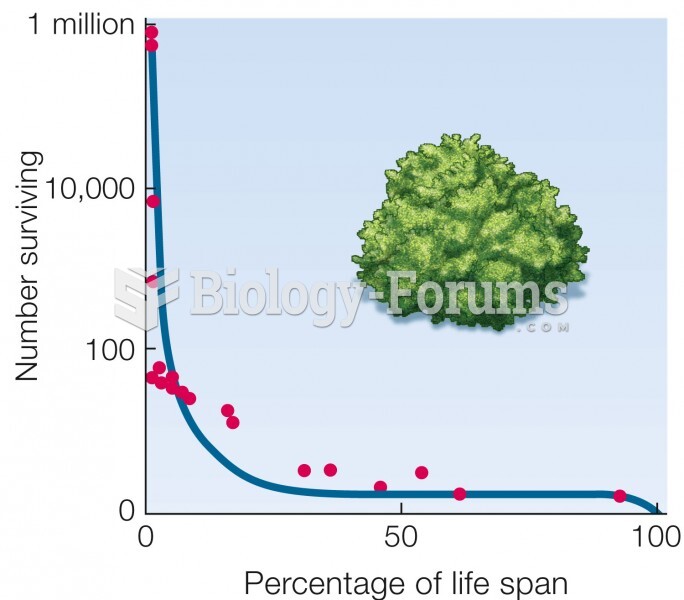 Type III curve. Mortality is highest early in life. Data for a desert shrub (Cleome droserifolia).